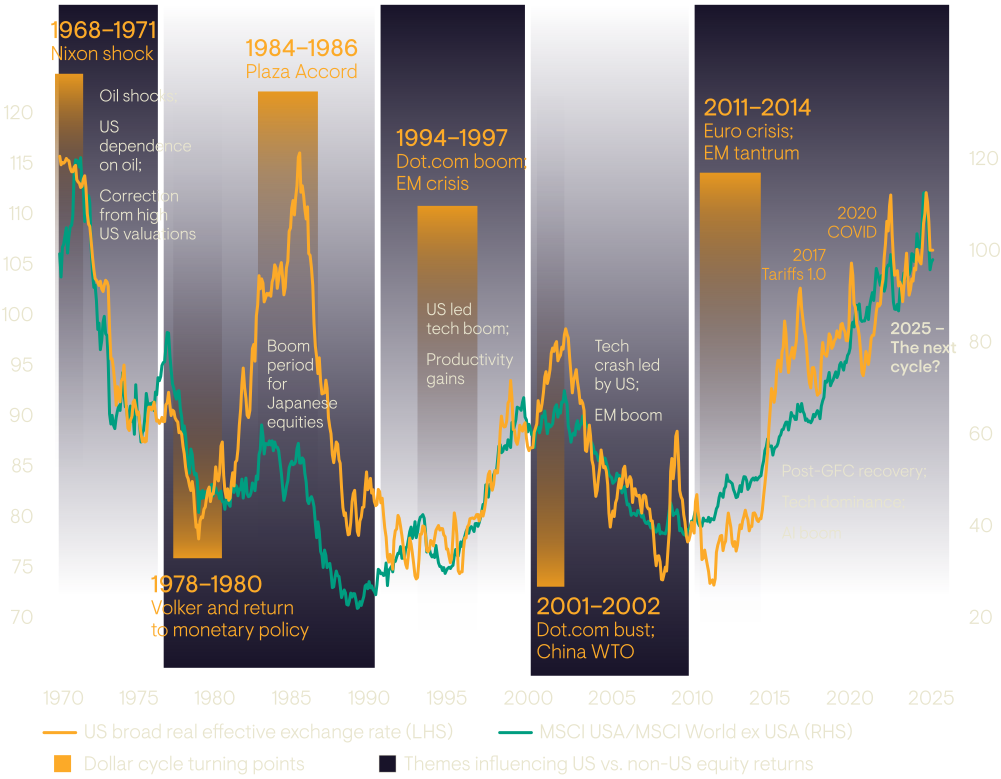
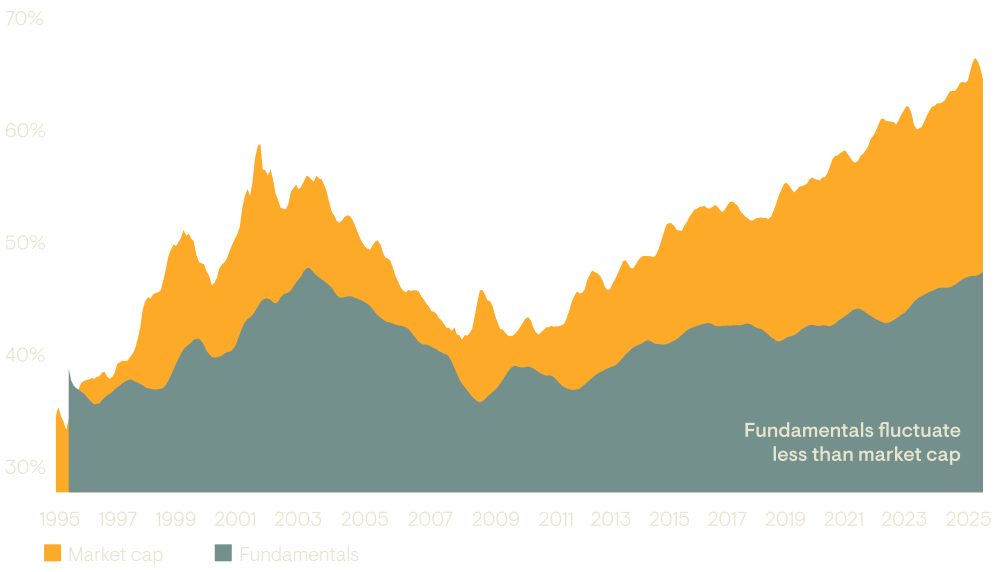
Evidence for a new cycle lies in the decisions taken by policymakers and investors worldwide who act on the four forces and appear to be in the process of reversing them.
We analyse each in turn.
Discomfort around the unique role of the dollar and US assets in the global financial system is not new, but recent US policy action has made it more pressing. US policy measures, notably using secondary sanctions and freezing Russia’s central bank assets, accelerated efforts toward de-dollarisation. The Trump administration has added to this impetus, contemplating additional taxes on US capital account transactions and creating unease around institutional stability, policymaking predictability, and longer-term fiscal credibility.
While these factors are less directly tied to equity market performance, even modest shifts in regional allocations driven by such dynamics could have meaningful impacts over time. Importantly, this does not imply large-scale selling of existing US assets by global investors. Instead, the key issue is how incremental savings and reserve allocations will evolve.
Figure 2: Official sector survey shows 73% of central banks expect to hold fewer dollars over the next five years
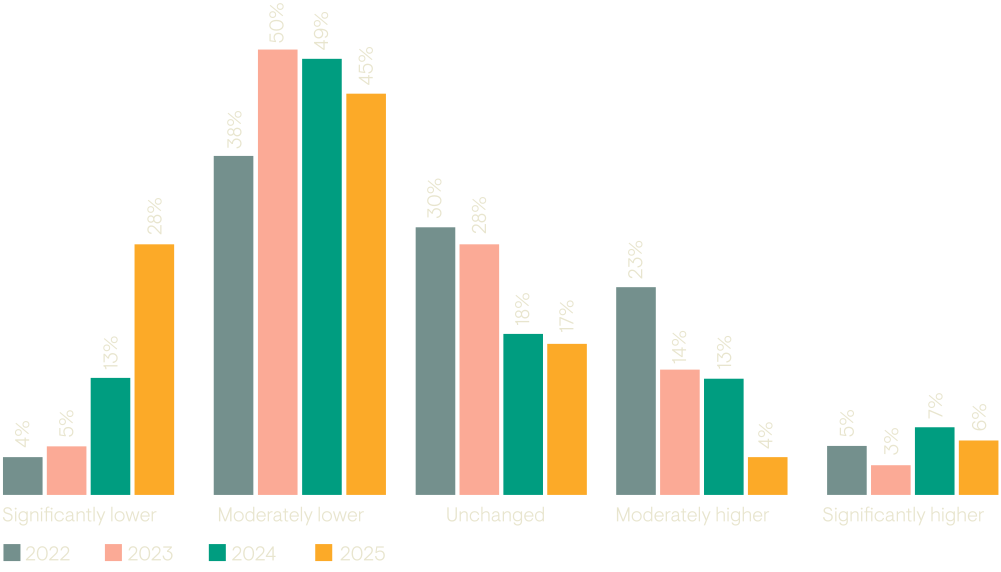
Source: World Gold Council, Central Bank Gold Reserves Survey 2025, Perspectives on gold reserves. Available at: gold.org
Throughout the last cycle, the US ran an expansionary fiscal policy. It delivered relatively strong growth, supported by interest rates that remained higher than in other regions, even at neutral levels, where they neither expand nor contract the economy. European economies, by contrast, were held back by austerity, delivered very limited growth, and interest rates became stuck at or below zero. With the notable exception of China, emerging economies were much more constrained in their ability to deploy fiscal and monetary stimulus.
The landscape is now shifting:
- Europe
In the years following the financial crisis, government austerity and balance sheet repair in the financial sector left Europe constrained but policy has now decisively shifted in a pro-growth direction. The Draghi report on competitiveness laid bare the challenges facing the EU and provided a blueprint for positive supply side reform whilst the Russia-Ukraine war has created a new sense of urgency. Fiscal rules have been substantially relaxed, enabling greater investment in defense and infrastructure, which should deliver substantial growth multipliers.
At the same time, rate cuts by the European Central Bank (ECB) are fuelling credit expansion. Bank balance sheets have been repaired and corporate and household debt are now at the lowest level relative to GDP in at least two decades. This provides strong scope for the private sector to re-lever, providing additional support to domestic demand. This healthier starting point means lower rates and higher public investment can be more effective, allowing fiscal and credit stimulus to translate into renewed momentum within European equities.
- Asia and emerging markets
Emerging market governments are on average much less indebted than their developed peers which, with some exceptions, provides significant fiscal headroom. The large Asian economies of India, Korea and Taiwan stand out for solid public finances alongside success in fostering private sector innovation. Taiwan provides a good example of how this matters. The government has maintained broadly balanced public finances in recent years, recording surpluses in both 2018 and 2019 after a period of careful debt and expenditure management. This discipline has allowed Taiwan to continue funding scientific research, expand education, offer targeted tax credits, and build science and technology parks, all of which have been central to its success in advanced semiconductor manufacturing.
Across Asia more broadly, the combination of sound fiscal positions and structural competitiveness provides a powerful foundation for growth. With policy space intact, governments can increase investment in areas such as infrastructure, technology and human capital, while maintaining market confidence. These conditions support the region’s resilience and underline its importance within emerging market equities as a driver of the next cycle.
- China
The focus of public sector investment in China has shifted from infrastructure to advanced manufacturing and household consumption, creating new avenues for growth.
China has built the world’s largest and most efficient manufacturing sector3.For example, CATL’s battery manufacturing facility in Ningde spans about 16 million square feet, roughly equivalent to 278 football fields. The plant produces one battery cell every second, operating nearly three times faster than major competitors in Japan and South Korea, with some industry reports suggesting an estimated 1,000 robots operate on the production lines4. Initially driven by public investment, China’s manufacturing strength is now sustained by world-leading research.
Chinese researchers rank first globally in highly cited academic papers and patent filings5, while Chinese universities consistently rank among the world’s top research institutions6. Chinese technological leadership is likely to remain a major factor in global economic dynamics in the coming years and will offer substantial opportunities for investors over the medium term.
Despite recent setbacks, such as the property market downturn, the Chinese consumer has been the largest single source of aggregate demand-growth in the world economy this century7 (Figure 3). Even as the structural rate of growth slows, the size and ongoing dynamism of this market make it impossible to ignore. Moreover, Chinese demand is of outsized importance in luxury goods, consumer electronics, and ecommerce, including emerging areas such as autonomous vehicles. With policy now stabilising the housing market and incentivising consumption through targeted support and short-term stimulus, China has the potential to meaningfully influence the outcomes for global and emerging equities over the next cycle.
Figure 3: The Chinese consumer has been the single largest source of aggregate-demand growth this century
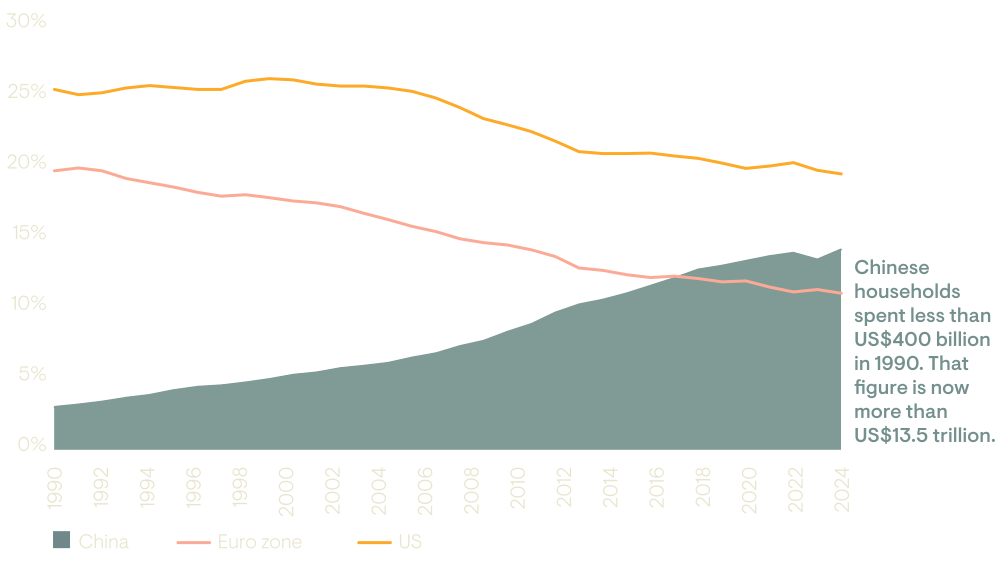
Source: IMF, June 2025 (data as at end 2023).
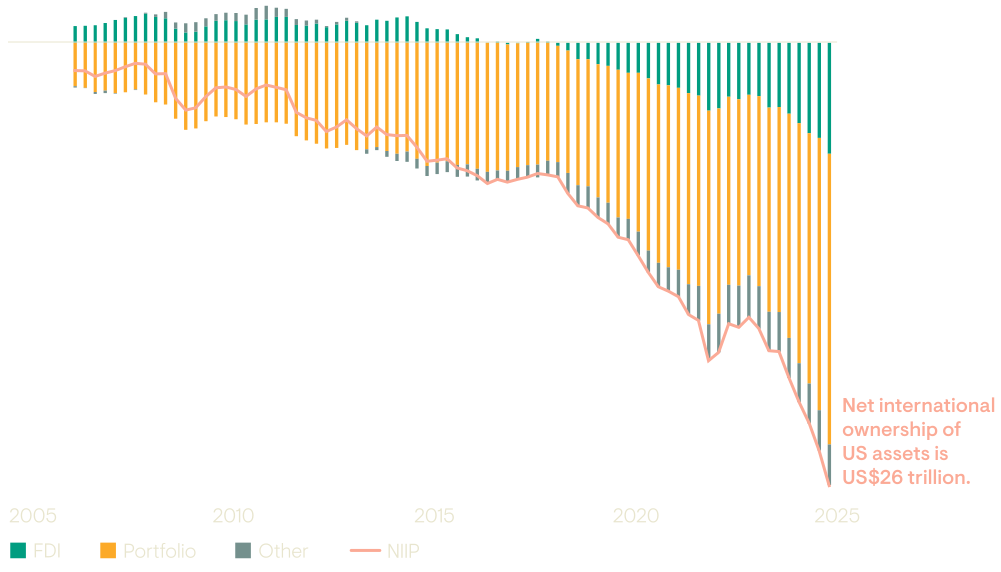
Since the global financial crisis, capital flows have surged into the US economy and have reached levels with no parallel in history. By the end of 2024, non-US investors held US assets worth US$62 trillion, more than double the size of the US economy. After subtracting non-US assets held by US investors, the US Net International Investment Position (NIIP) was US$26 trillion, approximately 90% of US GDP. The primary driver has been portfolio investment, with global investors attracted by higher yields and stronger growth prospects in US debt and equities. Given the scale of these holdings, even a modest slowdown or reversal of incremental capital flows into the US could have major ripple effects across global markets.
Figure 4: The scale of international ownership of US assets has no parallel in history
Source: Bloomberg, July 2025.
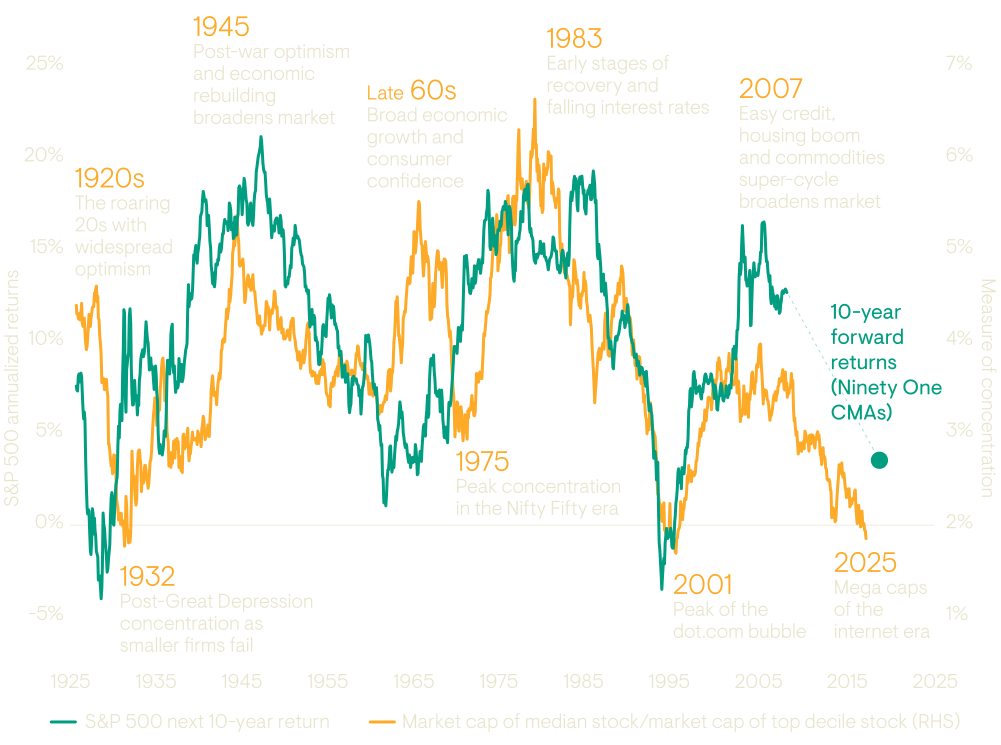
The success of US technology companies during the internet era played a significant part in driving these inflows. Internet platforms benefited from powerful network effects and economies of scale, enabling new digital business models to emerge8. Companies specialising in online advertising, software-as-a-service, and infrastructure-as-a-service grew rapidly, delivering exceptional profits. The result has been extreme market concentration, currently at its highest level since 2001, at the peak of the dot-com bubble, and before that, during the aftermath of the Great Depression.
Historically, periods of extreme market concentration are associated with weaker subsequent returns.
To measure concentration in the US equity market, we compare the average market cap of the largest 10% of US-listed companies to the market cap of the median US company. As of 30 June 2025, the median company had a market capitalisation of US$4.4bn – the size of the Avis Budget Group or the retailer Abercrombie & Fitch – and the largest decile had an average market capitalisation of US$240bn – the size of Goldman Sachs or McDonald’s. The median company was therefore valued at less than 2% of the average large company, in line with the lowest that this metric has been over the last 100 years.
Figure 5: Periods of intense concentration have typically led to weaker 10-year returns
Source: Ninety One, Bloomberg, July 2025.
Rethinking concentration in the age of AI
A broadening of market leadership in the next innovation cycle appears increasingly likely, driven by rapid AI advances and widespread adoption. In contrast to the internet era, the benefits of AI are expected to be distributed more broadly. Internet innovation in recent decades led to the growth of new platform business models and saw online revenue growth concentrating among a few winners. AI appears to be a general-purpose technology with the capability of automating a wide range of tasks currently undertaken by humans, leading to higher productivity growth and possibly profound changes to labor markets9. If this is right, then AI should deliver returns across many industries through cost savings and greater operational efficiency with smaller companies able to benefit from these advances in a similar fashion to the largest businesses.
Major US technology companies currently lead in AI model development and have significant resources to maintain their advantage. However, examples like DeepSeek or Z.ai show that other companies can quickly compete with much smaller budgets. Moreover, the AI-as-a-service model differs from the internet business models of the last cycle, with higher upfront costs and different scalability dynamics.
Successfully navigating this environment will require careful selection. The winners are unlikely to be simply the earliest adopters or those with the deepest pockets. Instead, investors should adopt a selective, bottom-up approach, focusing on companies that are intentional and strategic in their use of AI, able to convert incremental technological advances into meaningful, lasting performance.
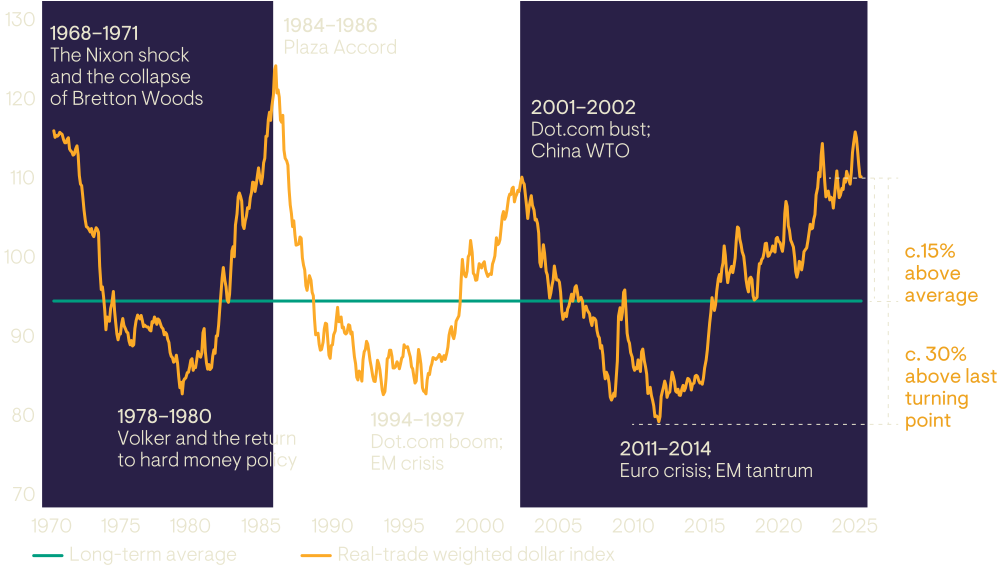
The Nixon shock (1971), Plaza Accord (1985), and launch of the Euro (2002) were important triggers for the prior downcycles in the US dollar and coinciding periods of non-US equity outperformance. Recent speculation around a potential ‘Mar-a-Lago accord’ echoes these historical examples, although formal intervention may not be required as the threat of policy action is already influencing behavior among policymakers and investors. One clear example is the Taiwan dollar’s 10% appreciation in the second quarter of 2025, sparked by anticipation of trade negotiations with the US.
Currency market interventions have a greater chance of success when they correct significant imbalances rather than exacerbate them. The US dollar has declined from its peak but remains around 15% overvalued relative to the long-run average real effective exchange rate, or 30% above the last time it reached a low point in 2011.
Figure 6: The US dollar sits 15% above its long-term average
Source: Bloomberg, July 2025.
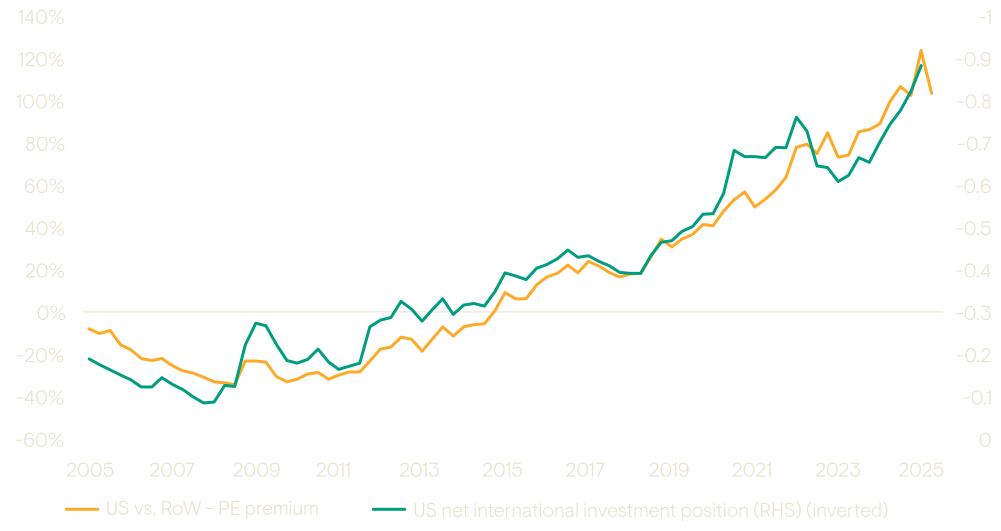
Furthermore, US equities are trading at 26x trend earnings versus 13x for ACWI ex-US equities. While the US equity market deserves a premium due to its quality and sector composition, this divergence has limits.
The high relative valuation of US equities appears closely linked to disproportionately strong capital inflows into US markets. Although there is some circularity, as rising equity valuations feed into the NIIP calculation, equities constitute less than 20% of the total NIIP, suggesting this is not the primary driver. Instead, it appears the same forces driving broader US capital inflows also support elevated US equity valuations.
Figure 7: The premium investors pay for US equities overlaps with international flows
Source: Bloomberg, July 2025.
A slowdown in the growth of US net liabilities could therefore put downward pressure on the valuation premium US equities currently enjoy.
3 The World Bank estimates the value added by the Chinese manufacturing sector was $4.7trn in 2024. The equivalent figures for the US and European Union were below $3trn each.
4 CATL’s Ningde (Fuding) facility spans about 1.5 million m² (~16 million ft², ~278 football fields) [EnergyTrend]. It produces one lithium-ion cell per second [InsideEVs], operates at around 95% automation [PR Newswire], and according to industry reports, uses around 1,000 robots on its lines [World Economic Forum, Global Lighthouse Network]
5 https://nistep.repo.nii.ac.jp/record/2000116/files/NISTEP-RM341-SummaryE.pdf, IP Facts and Figures.
6 https://www.nature.com/nature-index/.
7 Over the 20 years to end 2023 (the latest data available), the World Bank estimates that Chinese household consumption grew by $11.8trn or 11% per annum, whilst US household consumption increased by $11.1trn or 4.5% per annum in PPP terms. In real USD terms, the aggregate growth in Chinese household consumption in this period was slightly lower than the US ($5.9trn vs $6.5trn).
8 See Autor et al - The Fall of the Labor Share and the Rise of Superstar Firms and Emery - Market dominance in the digital age.
9 Significant uncertainty remains on the size of the productivity impacts of generative AI. For a range of different views see work by Goldman Sachs, McKinsey and Daron Acemoglu.