Artificial intelligence has been the dominant driver of the equity market narrative since the launch of ChatGPT in November 2022. In the early phase of this cycle, the market response was one-dimensional — AI innovation was an unambiguously positive force for equity returns. The largest gains accrued to large-cap US technology and internet companies leading innovation, but investors also rewarded businesses exposed to the build-out of supporting infrastructure, including semiconductors, technology hardware, data centres and the construction and energy providers needed to support them.
The enormous capital investment undertaken by these companies was widely expected to strengthen already dominant competitive positions and support a further uplift in earnings across the broader AI ecosystem. There has since been extensive debate about whether this wave of investment will ultimately generate attractive economic returns. That is an important question, but not one we seek to resolve here. The
answer will depend on how AI technology evolves, how quickly adoption broadens and how successfully early leaders convert heavy spending into durable cash flows.
The rapid improvement in AI capabilities has shifted market attention from the direct beneficiaries of the investment boom to the disruptive consequences of this innovation. The risk that existing business models will be displaced by new AI-enabled workflows, products and services has become impossible to ignore and some degree of creative disruption is unavoidable. Understanding which companies and sectors are likely to be left behind and which may prosper will require detailed bottom-up analysis beyond the scope of our capital market assumptions framework.
AI can feel like a uniquely futuristic technology, making historical comparison unhelpful. Yet a core principle of our CMA work is that the past remains a useful guide to a range of future outcomes. No historical analogy will map neatly onto AI, but previous technological transitions can still help frame the possible balance between value lost in disrupted sectors, value created in emerging industries and the net effect on equity market returns through the period of development and adoption.
We therefore look back at a range of historical technological revolutions in which the impact was sufficiently visible in listed equity markets to identify both relative winners and relative losers. This is an important qualification. The historical episodes we examine are not necessarily the most consequential innovations in economic history, but rather those where equity market data provides a reasonably clear record of the transition.
The historical analogues we explore are:
- The build-out of rail networks and the associated decline of waterborne transport, visible through disruption to canal businesses.
- The mass adoption of the automobile, which almost immediately replaced horse and carriage travel, but over time took both passengers and freight away from rail.
- Mass availability and affordability of electronic home appliances, focusing on the specific example of television ownership dramatically reducing cinema visits.
- The birth of the internet, which had broad impacts across retail, media, advertising and other sectors and is most easily isolated through its impact on the publishing industry.
The first and perhaps most obvious lesson we can draw is that the pace of technological change continues to accelerate. 2025 was a significant milestone in the development of AI as it marked the point at which adoption by US consumers passed 50%.5 (Adoption by businesses and across global consumers has been somewhat slower.) Generative AI hit this level three years after widespread commercial availability. This appears to be the fastest adoption rate of any major technological innovation in the last 200 years, with a trend towards ever faster adoption rates over this period:
- It took at least 30 years to build out 50% of the rail networks in the US and UK in the middle of the 19th century.
- Seventeen years passed from the launch of the Ford Model T in 1908 until 50% of US households owned a car by 1925.
- Adoption rates for home appliances varied, but the refrigerator and the television were among the fastest, with each taking about 10 years from the start of mass adoption to 50% US household ownership.
- The first consumer internet ISP services were launched in 1992, and US household access passed 50% in 2002.
Figure 8: The pace of technological adoption accelerates over time
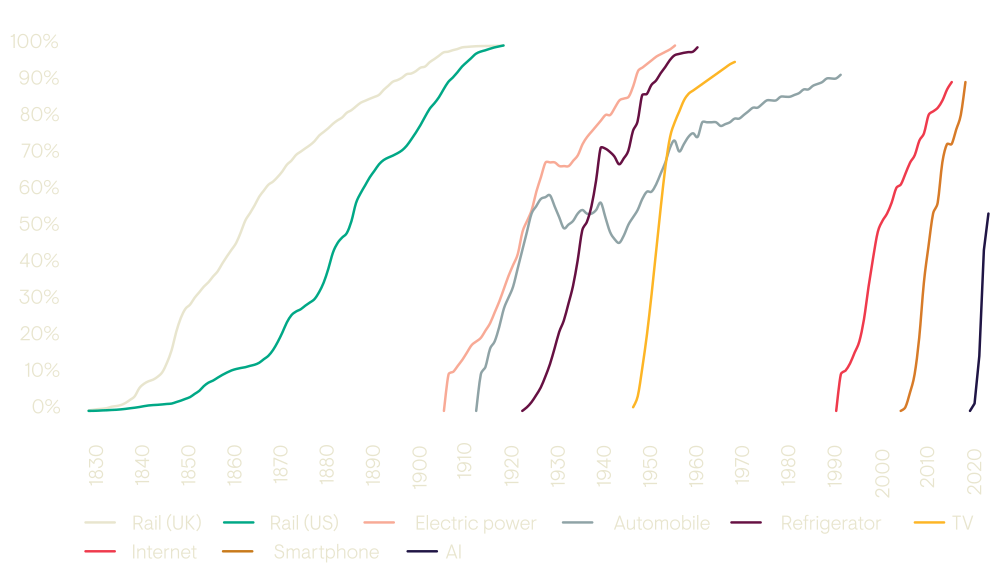
Sources: National Bureau of Economic Research, Historical Cross Country Technology Adoption Database (Horace Dediu; Comin and Hobijn), Real -Time Population Survey. 31 December 2025.
We now turn to the return outcomes observed through these historical technological transitions. For each example, we have calculated returns for the technological winners, losers and the overall market, and have broken the transition period into two phases: the initial innovation phase from the start of mass adoption to 50% adoption, and the maturity phase from 50% adoption to full adoption. In line with our CMA framework, we have decomposed returns into contributions from income, growth and valuation.
Care should be taken when interpreting these results, as they span very different historical eras and market segments; the sample size is small and each transition has unique characteristics.
The table shows the average annualised returns across the four historical transitions expressed in nominal local currency terms.6
Return drivers across technological adoption phases
|
Adoption <50% |
Adoption >50% |
Full period |
|
Market |
Old tech |
New tech |
Market |
Old tech |
New tech |
Market |
Old tech |
New tech |
| Income |
4% |
4% |
4% |
4% |
3% |
4% |
4% |
4% |
4% |
| Growth |
4% |
2% |
18% |
3% |
-4% |
6% |
3% |
-1% |
12% |
| Valuation |
2% |
0% |
-7% |
0% |
3% |
-1% |
1% |
1% |
-4% |
| Total return |
10% |
7% |
16% |
7% |
2% |
9% |
9% |
4% |
13% |
Source: Ninety One research, 31 December 2025. The underlying data sources and academic research informing these calculations are detailed in the tables for the individual historical examples.
Starting at the market level, total returns over the full course of a technological transition have been very similar to the long-run average for the US equity market. Studies of returns over the last 100 to 200 years estimate annual total returns of 8-10% in nominal terms and 6-7% in real terms.7 On average, returns were higher in the initial adoption period and lower in the later, more mature phase of the technology cycle. This reflects a combination of slightly slower growth and less favourable valuation adjustment in the second phase of the transition.
For the incumbent technology, slow growth and unchanged valuations produce below-market returns in the initial phase. Disruption intensifies once adoption of the new technology passes 50%: growth turns mildly negative, income declines somewhat, and even a positive contribution from valuations cannot prevent a very weak total return outcome.
For the new technology, strong growth underpins very strong returns in the first phase of adoption and more than offsets the de-rating that occurs. Growth slows sharply as technologies mature but, in these examples, remains well above market growth throughout the second half of the transition. Returns in
the later period are somewhat higher than the market, but only in line with long run averages.
These average figures conceal the nuances and specific factors that made each technological revolution unique. The case studies that follow set out the key features of each transition and show how these fundamental changes shaped the eventual return outcomes for both the disruptors and the disrupted.
From these case studies, we draw several broadly applicable lessons that help frame the outlook for equity markets in a time of AI-driven disruption.
For the disrupted sectors, three factors are key. Each suggests that the challenge facing companies exposed to AI disruption may be greater than in the average historical transition.
The first is the scale of market capitalisation at risk, which is not directly linked to the socio-economic importance of a technological innovation. In our historical examples, canals were the most significant market segment to be disrupted, accounting for more than 60% of UK equity market capitalisation in 1830. In contrast, the disruptive effects of automobiles and home appliances were more limited in market terms because, for the most part, the losers were small local businesses rather than large, listed companies. AI disruption risk lies somewhere between these two extremes, and the possibility of widespread disruption should not be dismissed. Based on the GICS sub-industries where markets have already begun to price in AI disruption fears, around 33% of MSCI AC World market capitalisation is at some risk of AI disruption.
Second, time is an important asset for incumbents. The longer the transition takes, the greater the opportunity for disrupted businesses to maximise the returns from their existing assets before customers fully switch. Canals, for example, had decades to exploit their installed networks as railroads were built out. In some cases, a more prolonged and visible technological change also gives incumbents enough time to adapt and succeed in the new paradigm. Radio broadcasters such as RCA, CBS and ABC had time to adapt their infrastructure for the shift to television, as technological change ran well ahead of consumer adoption, which accelerated only once prices fell and availability improved. The pace of internet disruption varied across sectors: the shift in retail spending from offline to online has been much slower than the shifts in advertising spend or media consumption, with only 19% of US retail sales taking place online in 2025.8 As a result, some bricks-and-mortar retailers, although initially slow to respond to the challenge of e-commerce, have successfully pivoted to omnichannel models that can compete with online-only offerings. In contrast, the pace of change in the AI revolution suggests that time may not be on the side of incumbents.
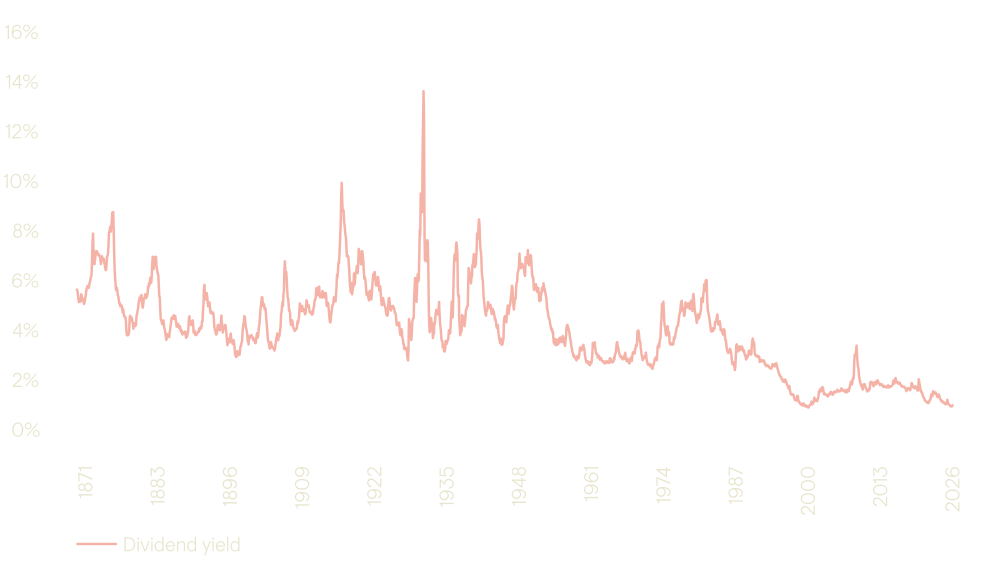
Third, income matters. In our examples, businesses built around the disrupted technology were, on average, able to maintain dividend yields in line with, or close to, the market throughout the period of disruption. This was vital to their ability to continue generating returns for shareholders, especially once their businesses began to shrink outright later in the technological transition. Current dividend income levels are much lower than in our historical examples, with the global market yielding 1.7% as at 31 March 2026. The software sector, at the centre of current disruption fears, is among the lowest yielding of all, with a dividend yield of just 0.7%, while also expending significant cash on buybacks to offset dilution from high levels of stock-based compensation. For a business in gradual decline, the optimal capital allocation
strategy is often to prioritise shareholder returns over reinvestment. From a market perspective, that can also support valuations, as it attracts an income seeking investor base and higher payout ratios can signal management confidence in the sustainability of current dividends. This may help explain why, on average, valuation became a positive driver of returns for disrupted sectors later in the disruption period. For many of the companies now seen as most at risk of disruption, however, such an approach would represent a dramatic strategic shift. That strengthens the case that income may offer less support to returns this time around.
For the disruptors, our case studies reveal two features which may not be well understood by investors.
First, the ability to deliver growth and total returns well above market levels falls sharply as the transition matures. A slowing growth trajectory as a technology matures is intuitive, but the scale of the downshift was dramatic in our historical examples. The distinction between the periods before and after 50% adoption suggests that investors should be careful about extrapolating recent growth rates for AI companies too far into the future. Alongside slower growth, excess returns also decline notably in the second phase of adoption, with total returns only slightly above the market.
Second, returns often accrue to a small number of winners and the average company on the right side of technological change does not necessarily outperform. This lesson is clear in the most recent historical
example, where internet platforms were the beneficiaries of powerful network effects and economies of scale, such that a single platform came to dominate each key vertical: Alphabet in search, Meta in social media and Amazon in e-commerce. This concentration of returns was also a feature of the early automobile market. Ford, the most successful early automaker, had a market share as high as 60% in the early 1920s but remained a private, family-owned business until 1956 – an interesting parallel with the venture capital ownership of many of the leading AI businesses. Performance in the listed auto sector was also heavily skewed: General Motors returned 29% per annum over the period; excluding GM, listed automakers returned a still-strong but much lower 9% per annum.
At the market level, returns have varied widely across technology revolutions, with underlying economic conditions and starting valuations always playing an important role in determining overall outcomes. Overall, we find no evidence that periods of technological transition are associated with stronger-than average returns. If anything, our case studies suggest that equity returns may be biased towards weaker-than-average outcomes once adoption of a major new technology passes 50%.
Canals to railways
The UK equity market was the world’s largest throughout the 1800s9, and equity issuance was a vital financing mechanism for the build-out of first a nationwide canal network and then of an equally expansive rail network. British canal companies delivered strong returns during their golden age from the late eighteenth century into the 1820s, and by that point canals accounted for more than 60% of UK market capitalisation.
From the mid-1820s, however, railways began to displace canals as the dominant transport technology. Canal market capitalisation fell by more than half between 1830 and 1860, but the shareholder experience was less severe than this decline in economic relevance might suggest. Because many canal businesses continued to generate cash and pay healthy dividends, total returns remained positive. Railway shares, meanwhile, experienced their own boom-and-bust cycle: prices more than doubled during the Railway Mania from 1843 to 1845 before surrendering those gains in the subsequent crash.
The expansion of the US rail network followed slightly after, financed by successive waves of speculative capital that repeatedly overbuilt ahead of demand, triggering major bankruptcies after the panics of 1857, 1873, and 1893. We focus on the UK experience as the better example of disruption to existing infrastructure and because of the more sizeable and mature UK equity market at the time.
Railways to automobiles
The automobile was the defining technological breakthrough of the early twentieth century, but the businesses most directly disrupted were wagon and carriage owners and manufacturers, which were mostly small private firms rather than listed companies.
Railways were also affected, particularly on the passenger side, while freight proved more resilient in the early stages. On the other side of the transition, the strongest returns from the new technology were heavily concentrated in a narrow group of winners. Ford, the most successful early automaker, was not listed until 1956, while performance in the listed sector was dominated by General Motors, which returned 29% per annum over the period; excluding GM, listed automakers returned a still-strong but much lower 9% per annum.
Auto innovation also helped to fuel excessive speculation in the US equity market in the 1920s, and the sector was particularly hard hit during the Great Depression. Automobile adoption stalled after the 1929 market crash, and it took another 20 years for adoption rates to surpass that initial peak.
Cinema to television
Widespread access to electric power and rising consumer incomes brought home appliances within reach of the average US household in the middle of the twentieth century. Refrigerators, washing machines and air conditioning reshaped daily life and created major new consumer industries. We highlight the example of television, given its disruptive impact on the large and highly profitable motion picture industry in the US. From the end of World War II to the early 1960s, annual movie theatre admissions fell from over four billion to around one billion. Several major studios faced severe financial distress, and the sector traded at depressed valuations for much of the period. The movie studios that survived adapted and eventually became core assets of diversified media conglomerates.
The technological innovators we focus on are TV set manufacturers, including RCA, Zenith, Westinghouse and Magnavox. They started out as manufacturers of radios, so were at risk of disruption themselves, but were early to recognise the potential of the cathode-ray tube and worked towards the commercialisation of the technology. The three large US broadcast networks were similarly adept in navigating the shift from radio to TV.
The internet and publishing
The commercialisation of the internet from the mid-1990s was transformative for telecoms, media, advertising and retail, but the disruptive impact was felt most acutely in the publishing industry. Newspaper advertising revenue — the economic engine of the industry — peaked in the US at close to US$50 billion in 2005 and collapsed by 70% over the following decade.10 Listed newspaper companies lost most of their market value; several filed for bankruptcy. Other offline businesses saw similarly rapid falls into obsolescence – sales of physical audio and video media declined precipitously and department stores and travel agencies disappeared from many city centres. The disruption was not uniform; some categories of retail proved less suited to e-commerce, while other large retailers used their existing scale, brand and logistics
expertise to pivot to successful omnichannel models. As old forms of media distribution declined, the value of the strongest IP assets was retained or even enhanced by the ability to broadcast to a global audience at minimal incremental cost.
On the winning side, returns were heavily concentrated: by the 2010s, a handful of platform businesses captured the bulk of the value created, but only after numerous early internet companies — and their investors — were wiped out in the dot-com crash.
What history tells us
Taken together, these historical examples suggest that AI is likely to generate substantial value within a relatively narrow group of winners, while also driving value erosion across disrupted sectors. The net effect
on overall equity market returns will therefore depend on the balance between these forces over the course of the adoption cycle, rather than implying a uniformly stronger return environment.
Canals to railways
|
1830 – 1860
Adoption <50% |
1860 – 1890
Adoption >50% |
1830 – 1890
Full period |
|
UK |
Canals |
Railways |
UK |
Canals |
Railways |
UK |
Canals |
Railways |
| Income |
4% |
4% |
6% |
6% |
4% |
6% |
5% |
4% |
6% |
| Growth |
0% |
0% |
5% |
0% |
-1% |
-1% |
0% |
0% |
2% |
| Valuation |
0% |
0% |
-5% |
0% |
1% |
1% |
0% |
0% |
-2% |
| Total return |
5% |
3% |
7% |
6% |
4% |
6% |
5% |
4% |
6% |
| Inflation |
|
0% |
|
|
0% |
|
|
0% |
|
| Real return |
5% |
4% |
7% |
6% |
4% |
6% |
5% |
4% |
6% |
Source: Campbell, Gareth; Grossman, Richard S.; Turner, John D. (2019) Before the cult of equity: New monthly indices of the British share market, 1829-1929, QUCEH Working Paper Series, No. 2019-01, Queen’s University Centre for Economic History. UK Office for National Statistics.
Railways to automobiles
|
1911 -1925
Adoption <50% |
1925 -1939
Adoption >50% |
1911-1939
Full period |
|
US |
Rail |
Autos |
US |
Rail |
Autos |
US |
Rail |
Autos |
| Income |
6% |
6% |
5% |
4% |
4% |
6% |
5% |
5% |
5% |
| Growth |
2% |
1% |
24% |
-2% |
-12% |
-3% |
0% |
-6% |
11% |
| Valuation |
1% |
-1% |
-5% |
1% |
3% |
6% |
1% |
1% |
0% |
| Total return |
9% |
6% |
28% |
4% |
-4% |
9% |
6% |
1% |
18% |
| Inflation |
|
5% |
|
|
-2% |
|
|
1% |
|
| Real return |
4% |
1% |
23% |
5% |
-3% |
10% |
5% |
-1% |
17% |
Source: The Cowles Commission for Research in Economics. Lawrence H. Officer and Samuel H. Williamson, The Annual Consumer Price Index for the United States, 1774-Present.
Cinema to television
|
1945 - 1955
Adoption <50% |
1955 - 1965
Adoption >50% |
1945 - 1965
Full period |
|
US |
Cinema |
TV |
US |
Cinema |
TV |
US |
Cinema |
TV |
| Income |
6% |
7% |
5% |
3% |
3% |
3% |
4% |
5% |
4% |
| Growth |
9% |
3% |
11% |
5% |
-5% |
4% |
7% |
-1% |
7% |
| Valuation |
1% |
-4% |
-1% |
2% |
13% |
4% |
1% |
4% |
1% |
| Total return |
16% |
6% |
16% |
11% |
11% |
11% |
14% |
8% |
14% |
| Inflation |
|
4% |
|
|
2% |
|
|
3% |
|
| Real return |
12% |
2% |
12% |
9% |
10% |
10% |
11% |
6% |
11% |
Sources: Eugene F. Fama and Kenneth R. French, Robert Shiller, US Bureau of Labor Statistics.
Print to online media
|
1993 - 2003
Adoption <50% |
2003 - 2018
Adoption >50% |
1993-2018
Full period |
|
US |
Publishing |
Internet |
US |
Publishing |
Internet |
US |
Publishing |
Internet |
| Income |
2% |
1% |
0% |
2% |
2% |
1% |
2% |
2% |
1% |
| Growth |
3% |
6% |
32% |
8% |
0% |
23% |
6% |
2% |
27% |
| Valuation |
5% |
5% |
-19% |
-2% |
-4% |
-13% |
1% |
-1% |
-15% |
| Total return |
11% |
12% |
14% |
8% |
-1% |
11% |
9% |
4% |
12% |
| Inflation |
|
2% |
|
|
2% |
|
|
2% |
|
| Real return |
8% |
10% |
12% |
6% |
-3% |
9% |
7% |
2% |
10% |
Source: Eugene F. Fama and Kenneth R. French, Standard & Poors, Nasdaq, US Bureau of Labor Statistics.
5 Generative AI Adoption Tracker
6 Full breakdown of the returns for each of the historical examples are provided in the appendix, including returns in both nominal and real terms.
7 See for example, work by Dimson, Marsh and Staunton, Robert Shiller and Jeremy Siegel.
8 Source: Census Bureau Quarterly Retail E-Commerce Sales report Q4 2025.
9 Stock Market Capitalization over the Past 250 Years: The Dominance of the Anglo Countries - Finaeon
10 Pew Research Center.