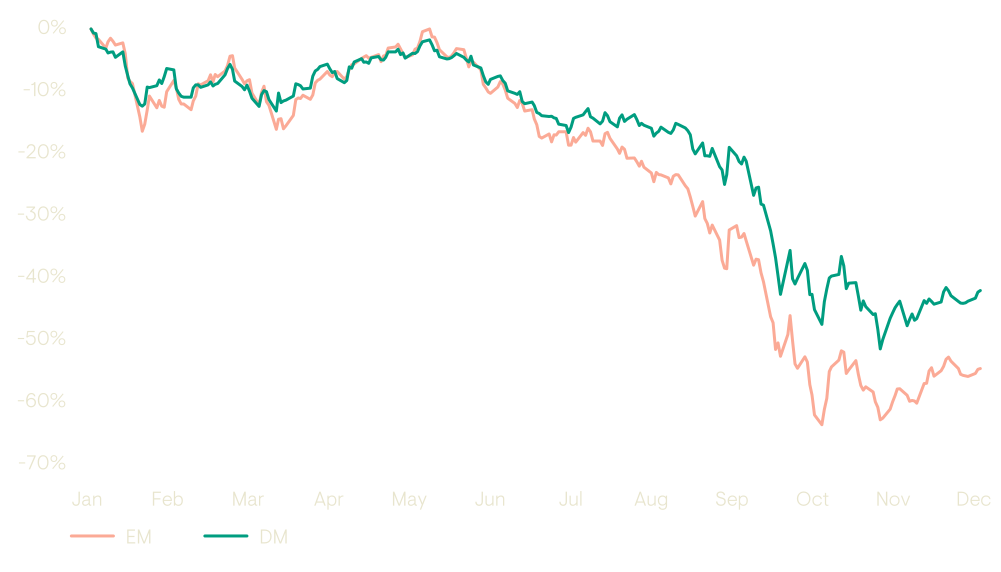
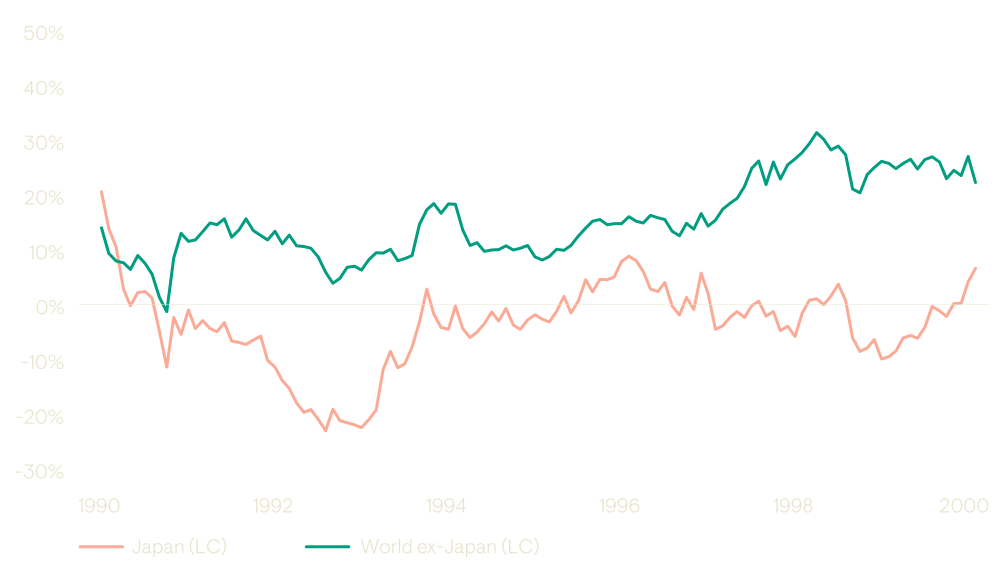
First, EM underperformance over the last decade can be explained by a number of idiosyncratic factors, which we outline here. Each of which will play out differently over the next decade, as addressed in our structural research titled paper, ‘In the Crossfire’.
- Market composition impacts from Chinese IPOs were a major one-time drag on returns, a factor that is still not widely understood. Chinese tech stocks were included in EM equity indices at their peak valuations and then derated spectacularly. This affected returns negatively. It will be difficult for a repeat of this scenario in the future because it would require a return to the pre-Xi era in terms of domestic governance and international relations. In fact, the negative influence of market composition changes has already halved in 2022 and 2023 relative to the past decade.
- During the 2010s, suboptimal sector allocations weighed down returns as central banks maintained an ultra-low-rate environment and commodities suffered a downcycle. In contrast, returns in the EM technology sector, which now represents 20% of the EM index, were very strong despite their low sectoral weight. Looking ahead, we anticipate that the drag on returns from sectors such as materials, energy, and financials will stabilise, while the EM tech sector will be the home of many winners.
- The extraordinary opportunity cost of investing outside of US equities created a challenging scenario for investors considering alternatives. In our view, replicating the same level of performance by US equities will be a formidable task as it necessitates surpassing already high expectations.
To be more specific, revaluation contributed significantly to the annual returns in the US over the ten years to September 2023, accounting for a positive 2.8 percentage points per year. In contrast, EM saw a negative revaluation return of -0.6% per annum, and Europe, Australasia, Far East (EAFE) had a -0.2% per annum return in this regard. A core principle of our Capital Market Assumptions approach is that starting valuations are a major driver of long-term returns. Weak past returns make future returns look better (Figure 3).
Figure 3: Return contributions 10 years to 30 September 2023
|
US |
EAFE |
EM |
Logarithmic return
(local currency) |
Income |
1.9% |
3.1% |
2.8% |
| Growth |
6.4% |
4.1% |
3.0% |
| Revaluation |
2.8% |
-0.2% |
-0.6% |
| FX vs USD |
0.0% |
-2.8% |
-2.8% |
| Geometric Total Return (USD) |
11.8% |
4.3% |
2.5% |
Source: Ninety One calculations
That suggests current valuations will be a significant headwind, particularly for US equity returns. As a result, we expect the return impact of international diversification over the next ten years to look very different to the experience of the last decade.
Second, the starting point for diversification in investment portfolios is rooted in the recognition that the future is inherently uncertain. The concept of diversification is so embedded in financial theory that one survey of finance academics concluded that “it may be the only thing our experts fully agree on.”3
Investors do not know which allocations in a portfolio will perform, and which will not. Faced with uncertainty, they should hold a spread of investments that will behave differently, thereby maximising the chance of meeting long-run return objectives across a range of possible scenarios. Even though most portfolios are significantly overweight US assets at this point in the cycle, this was not true just after the GFC and it is not difficult to imagine future conditions in which this will not be true again.
As discussed earlier, Harry Markowitz pointed out many years ago that portfolio risk can be reduced without sacrificing expected return by constructing a portfolio that is not perfectly correlated. Over-concentration of risk in investments with fat downside tail risks — such as equities — is particularly unwise given the additional difficulty of recovering from substantial drawdowns.
Third, while some equity markets don’t benefit from geographic diversification, most do.
The most defensible form of home bias is probably in the US. Vanguard’s Jack Bogle and Berkshire Hathaway’s Warren Buffett have argued that there is a case for investors generally, and especially US investors, to have a structural overweight to the US due to the scale of the economy, the global reach of its businesses, and its robust institutions.
US returns since 1900 have certainly been exceptional.4
However, structurally, those returns were underpinned by the fact that the US experience in the 20th century was exceptional. The US achieved unparalleled military, technological, and economic supremacy during the 20th century, with no revolutions, hyperinflation or wars on home soil over the period. In contrast, investors in Germany in the 20th century would have faced near-total capital losses on two separate occasions.
Many investors think that US exceptionalism will continue. And perhaps an argument can be made for home bias among US equity investors: US stocks account for half the global equity indices, and large cap US companies get a third of their revenues from abroad.
However, if a US institution for various reasons believes the future will play out differently from the past, and thus does not want 100% equity exposure to US equities, then diversification makes sense. US institutions may also seek diversification as a safeguard against long periods when US equities underperform global markets, as witnessed in the early 2000s, or during the 1980s.
Meanwhile, for an institutional investor in Europe or Japan diversification will more often be the right decision.
A study by Dimson, Marsh and Staunton attempted to measure the gains for investors in markets where favouring local investments (home bias) proved beneficial and where it wasn’t. They looked at the Sharpe ratios, which show risk-adjusted returns, for investors in various countries with exposure to domestic equities and to a geographically diversified portfolio. Their findings over the past 50 years revealed that, in most countries, investing globally resulted in better Sharpe ratios compared to investing only in domestic stocks. However, there were a few exceptions to this trend. One of these exceptions was the United States.5
In other words, diversification beyond home markets has generally worked, with important exceptions.
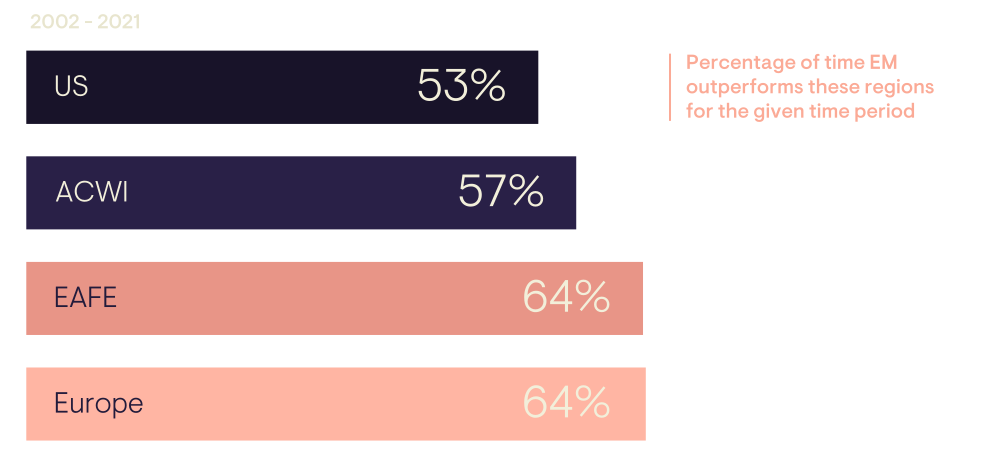
As we learned in In the Crossfire, it’s evident that EM returns remain competitive against European or Japanese equities most of the time. Notably, EM outperformed EAFE (Europe, Australasia and the Far East) two-thirds of the time since 2001.
Figure 4: How often does EM outperform US, ACWI, EAFE and Europe (1-year rolling)
Source: Ninety One - In the Crossfire, MSCI.
Even in the difficult period from 2011-2021, when Russia went to zero and “Common Prosperity” prompted a revaluation of Chinese assets, EM outperformed EAFE around half the time.
That is a significant finding, even for US investors. Unless they intend to allocate their entire equity portfolio exclusively to the US, EM equities offer a competitive choice alongside other alternatives.
Fourth, EM assets often outperform strongly in dollar downcycles, which tend to play out over a multi-year period. They could be an especially strong diversifier if a dedollarisation scenario adds to a cyclical dollar downturn.
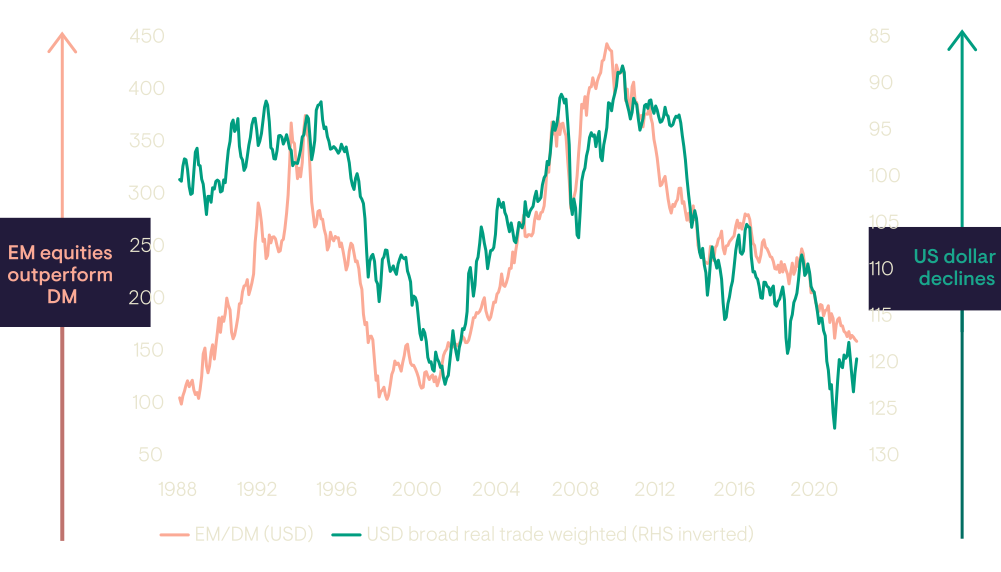
EM cycles have typically closely coincided with the USD downcycles. This relationship has held since the 1990s, when many EM currencies transitioned to freely floating exchange rates. Remarkably, it was also true in the 1970s and 1980s when EM currencies were pegged and managed.
As In the Crossfire highlighted, following a peak in the US dollar, EM equities have typically risen by 30-50% in the following 6-12 months. Similarly, EM local bonds have risen by 20-25% within the same timeframe. This underscores the significance of global currency dynamics on emerging markets.
Figure 5: The relative performance of EM vs. DM equities compared to US dollar strength (1988-2022)
Source: Ninety One - In the Crossfire, MSCI.
The relative outperformance of emerging markets compared to developed markets during periods of dollar decline can be explained by the role of dollar invoicing, the burden of dollar-denominated debt for EM corporates and governments falls, as does the ‘safe asset’ bias towards DM assets.
For global investors, this diversification away from dollar-based assets becomes particularly salient in the context of tail risk scenarios for the global economy. These scenarios might lead to the dollar losing value against the rest of the world at an accelerated rate over the next five to 10 years, potentially exceeding current expectations.
That could result from a dedollarisation or financial deglobalisation scenario that we discussed extensively in 2019 and that has received a renewed impetus since the central bank sanctions applied on Russia after its invasion of Ukraine.
Positioning against this outcome with EM rather than other DM currencies is more likely to provide a positive carry, especially considering the favourable initial yields in EM fixed income.
3 In Pursuit of the Perfect Portfolio, “Starting from Markowitz, we can see that the idea of diversification of a portfolio as a means to reduce risk is universally accepted, but this may be the only thing our experts fully agree on.”
4 Dimson Marsh via AQR.
5 Dimson Mash