Consensus thinking on fiscal policy has shifted dramatically over the past five years. For a decade following the Global Financial Crisis, Western governments and their economic advisors viewed excessive levels of government debt relative to GDP as a sure path to economic calamity. As a result, austerity policies were implemented well before the recovery from that crisis was complete.
This is now widely viewed as a failure, both on its own terms as the negative impact on growth meant that debt-to-GDP ratios remained elevated or even increased, and in terms of broader economic and political consequences. The combination of persistently tight fiscal and very loose monetary policy exacerbated widening inequality as real wages stagnated while asset values rose, feeding an environment of growing political polarisation and eroding trust in institutions.
The response to the COVID-19 crisis presented an opportunity to correct course. Not only was dramatically more fiscal firepower unleashed to manage the crisis, but there was also a determination to avoid undermining the recovery through premature policy tightening. In the first quarter of 2025, five years after the COVID shock, budget deficits remain at levels once only seen in the depths of recessions: almost 4% of GDP in the eurozone and a remarkable 7% in the US.
Beyond the simple arithmetic of debt and deficits, financial markets have focused on the credibility of government policy to balance growth and fiscal management. Achieving durable fiscal consolidation requires sustaining growth above the level of interest rates on government debt (often referred to as R minus G). Such credibility is hard-earned and easily squandered. For example, the UK gilt crisis in September 2022 was triggered by a loss of confidence in the policy agenda of the Truss government. More recently, the chaotic rollout of new US tariff rates in April 2025 prompted some to question whether US Treasuries can continue to serve as the safe asset underpinning the global monetary system.
An additional vulnerability for sovereign borrowers arises when there is a heavy reliance on international investors to buy their debt. International investors have greater flexibility in allocating capital, incur currency risk and cannot be coerced through capital requirements or financial regulation to hold government securities. This risk can be assessed through the lens of the Net International Investment Position (NIIP), the difference between the country’s ownership of financial assets in other countries and the domestic assets owned by foreigners.
We can use the four metrics highlighted above – debt, deficits, R minus G and NIIP – as a framework to understand the nature of fiscal risk around the world. The table below shows this information for global developed and emerging markets. Japan and China stand out sharply from these broader groupings, with much higher debt, lower interest rates and higher net foreign assets; therefore, we include aggregates excluding these countries.
Fiscal fundamentals in developed and emerging markets
| |
Debt/GDP
2030 |
Structural budget deficit
2030 |
Bond yield minus GDP growth
2025-30 |
NIIP
2025 |
| DM |
119% |
-1.5% |
-0.4% |
-25% |
| EM |
82% |
-2.9% |
-0.3% |
12% |
| DM ex-Japan |
112% |
-1.4% |
-0.1% |
-32% |
| EM ex-China |
59% |
-0.9% |
0.3% |
2% |
Source: IMF, Bloomberg.
This reveals a stark differentiation between developed and emerging economies, excluding China: emerging markets are less indebted, closer to balanced budgets and hold positive net foreign assets. Interest rates minus growth appear more challenging for emerging markets ex-China as a result of currently elevated real interest rates in some of the markets, although there is scope for this to change over time.
This fundamental analysis is supported by converging risk characteristics across global markets, with developed market government bond markets becoming more volatile and susceptible to shocks, while emerging markets have demonstrated improved quality.
For developed market issuers in their own currency, hard default risk remains remote, although not impossible under certain political scenarios; however, higher inflation and currency debasement are very real risks. Rising fiscal risk in developed markets implies that investors now demand a higher term premium to own longer-dated bonds.
Fiscal risk therefore interacts with the CMA process via our revaluation return estimates. The downside risk to these estimates is that term premia rise further, leaving the yield on a 10-year bond in ten years’ time higher than markets currently expect.
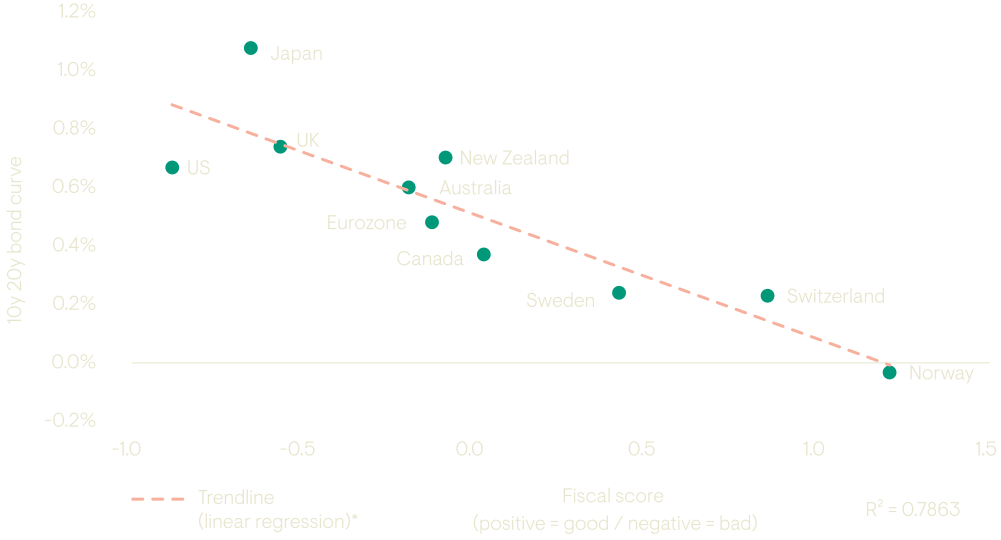
We can apply the same framework to assess where this risk is greatest across developed government bond markets. We calculate an overall fiscal score for each country as the simple average of the normalised values for the four metrics across the universe. The scores are intuitive and suggest that Norway has the highest quality public finances, followed by Switzerland and Sweden. At the other end of the spectrum, the US, Japan and UK have similarly elevated levels of fiscal risk.
When we plot these fiscal scores against the steepness of the long end of the curve for each market, we see a very clear relationship, with the fiscal scores explaining almost 80% of the variation in curve slope.
Figure 5: Higher fiscal risk is associated with steeper curves
Source: IMF, Bloomberg & Ninety One calculations.
*Showing the average relationship between the fiscal score (x-axis) and the 10y–20y bond curve (y-axis) across countries.
The markets which are furthest from fair value based on these fundamental metrics alone are the US, where fiscal risks appear underpriced, and Japan, where fiscal risks appear overpriced.
In part, this may reflect the divergent nature of monetary policy in these markets. Tight policy in the US and loose policy in Japan has an impact on the shape of the yield curve, which can extend all the way to the long end. It is also possible that the US dollar’s status as the dominant global reserve currency remains a driver of additional demand for US Treasury duration. Another consideration is that these relationships may become non-linear when debt rises beyond a certain point, which Japan may already have breached.
We can use the values for the curve suggested by this relationship to give an idea of the type of return impacts which might be seen if developed bond markets moved towards their fair values. This would represent a meaningful reduction in prospective returns from 10-year US Treasuries, smaller additional headwinds to eurozone and UK bonds and a slight uplift to Japanese government bond returns. Importantly, this analysis only accounts for current fiscal data and expectations. Policy changes which lead to either a further weakening or an improvement in fiscal outlooks could change the picture dramatically on a ten-year horizon.
Government bond returns in curve repricing scenario
| |
US |
Eurozone |
Japan |
UK |
| 10y 20y – current |
0.7% |
0.5% |
1.1% |
0.7% |
| 10y 20y – fair value |
0.9% |
0.6% |
0.8% |
0.8% |
| Return forecast (p.a.) |
4.2% |
2.8% |
1.6% |
4.9% |
| Curve repricing scenario return forecast (p.a.) |
3.7% |
2.7% |
1.9% |
4.8% |
Source: IMF, Bloomberg and Ninety One calculations.
Corporate credit in an era of fiscal excess
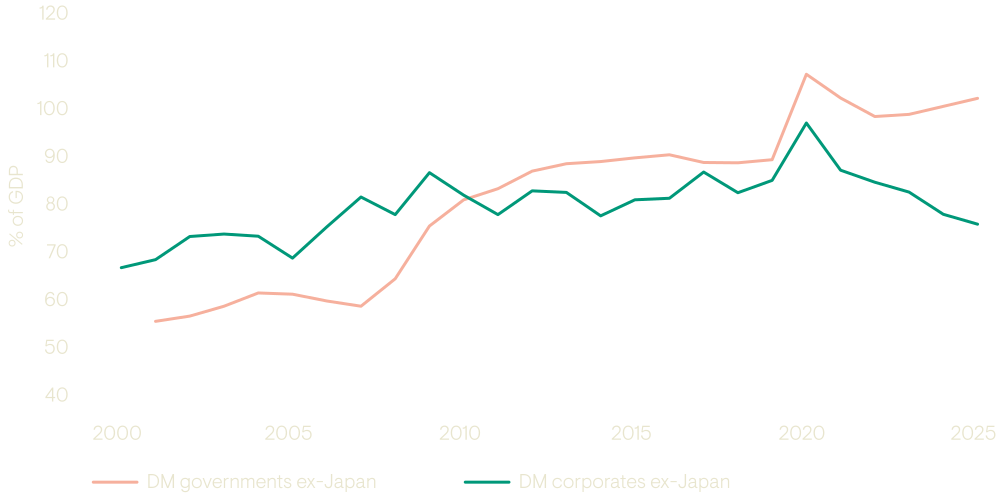
While debt sustainability trends appear negative for developed market sovereigns, fundamentals for corporate borrowers appear to be on a sounder footing in both developed and emerging markets.
Leverage trends are moving in the opposite direction with the corporate sector deleveraging in the period since the COVID crisis, taking aggregate leverage to the lowest levels in a decade. As with sovereigns, EM corporate borrowers are on average much less indebted than DM corporates.
Figure 6: Government and corporate leverage in developed markets
Source: IMF, BIS, Bloomberg and Ninety One calculations.
Figure 7: Government and corporate leverage in emerging markets
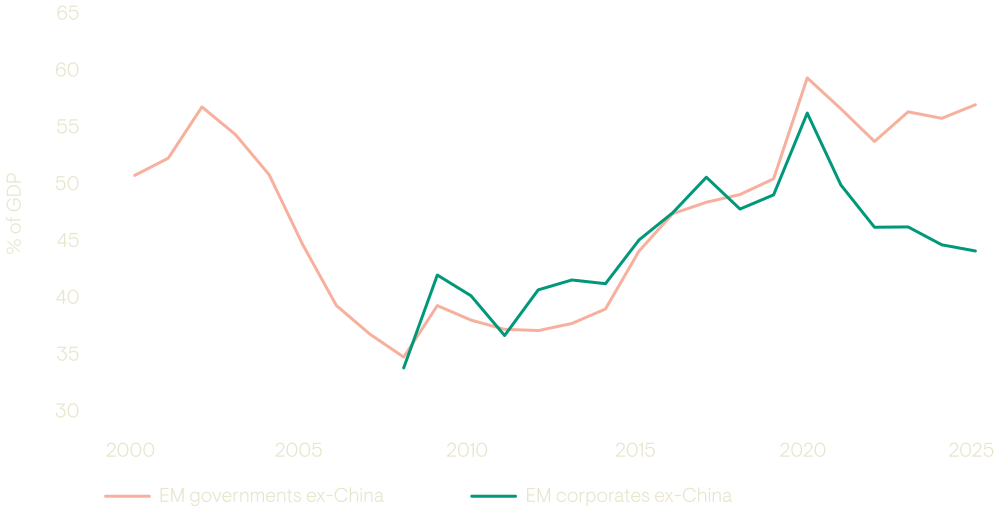
Source: IMF, BIS, Bloomberg and Ninety One calculations.
Market pricing reflects solid corporate fundamentals with credit spreads at historically tight levels. The increased risk now evident in government bond markets makes historical comparisons more complicated. A real question has emerged as to whether USD credit markets can continue to rely on US Treasuries as a straightforward risk-free reference, as they have done previously.
One potential response is to shift from viewing credit in terms of spreads over US Treasuries to also consider (or instead consider) spreads over USD swap rates. This is already common practice in EUR credit markets, partly because eurozone government bond markets differ widely in their fiscal risk premia and, or, convenience yields.
Figure 8: US investment grade corporate bond spreads
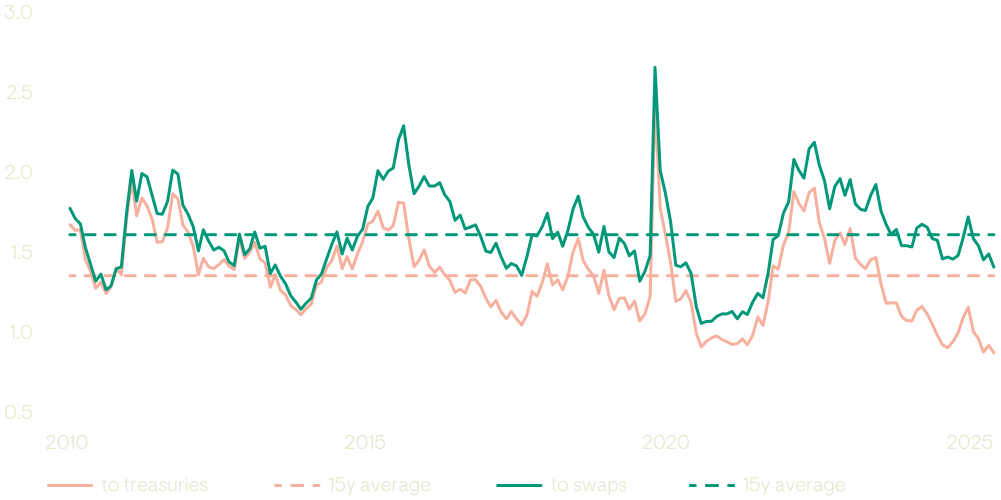
Source: Bloomberg and Ninety One calculations.
Another approach is to apply an absolute risk lens when assessing credit quality. This aligns with the framework we use in our credit loss forecasts, which do not differentiate between sovereign and corporate borrowers.
We also see evidence of an absolute perspective emerging in credit markets, as the ‘sovereign ceiling’ for corporates no longer holds in all cases. Across both emerging markets and the eurozone, there are corporate issuers trading inside their sovereign yield curves, and even instances where USD bonds issued by Microsoft and Johnson & Johnson2 have yielded less than the equivalent US Treasury issues. While technical factors partially explain these dynamics, they are only possible against the background of the fundamental changes we have described. Over time, we may see more corporate issuers with higher ratings and lower yields than their sovereigns, as the fortunes of high-quality global businesses can at times diverge dramatically from the domestic fundamentals of their home country.
The risk for corporates may be that government largesse becomes a more direct constraint on the private sector in one of two ways. First, private sector borrowing can be ‘crowded out’ by the public sector. In this scenario, increased supply of government debt limits the pool of savings available to lend to the corporate sector, pushing up yields across the economy. Second, in more extreme scenarios where there is a shortfall in government revenues, the sovereign has the power to change tax policy or legislation to extract value from corporates.
2 This is not a buy, hold or sell recommendation.