Key takeaways
- Over the past decade, buybacks have outpaced new share issuance, shrinking the pool of US shares on the market (also called de-equitisation) and adding roughly 0.7% a year to returns between 2015 and 2025.
- The AI IPO wave, SpaceX, OpenAI and Anthropic’s listings, plus fresh issuance from established tech giants, could put that trend into reverse: from scarcity driven by buybacks to abundance driven by new supply.
- We’re not predicting a market decline. Nobody can know in advance when an AI investment boom will end, and the initial IPO proceeds look manageable for a market this size.
- The bigger risk is what follows: years of rising issuance and insider selling as early investors cash in, together amounting to a US$4 trillion wave of new stock, close to a 4% expansion of the entire US public equity market.
- Our Capital Market Assumptions put ten-year US returns at 2.7% a year. In our most negative float-expansion scenario, modelled on the dot-com-era TMT bubble, that figure could fall towards flat, or even negative.
- If that compression happens, investors may have to look for returns beyond the US. Emerging markets, held back for the same structural reason for a decade, now look better placed to provide those returns.
A multi-year bull market: how long can it last?
US stocks have just had one of their strongest three-year runs in modern history. Between 2023 and 2026 (30 June), the S&P 500 returned 26%, 25%, 18% and 11%. Only two periods since 1945 have delivered higher: the late-1990s dot-com bubble and the post-war boom of the early 1950s, both of which produced several overlapping three-year windows in the top ten (see Figure 1).
Figure 1: The latest US equity rally ranks among the strongest since 1945
Rolling three-year S&P 500 returns, 1945-2025; highlighting the top 10 periods.
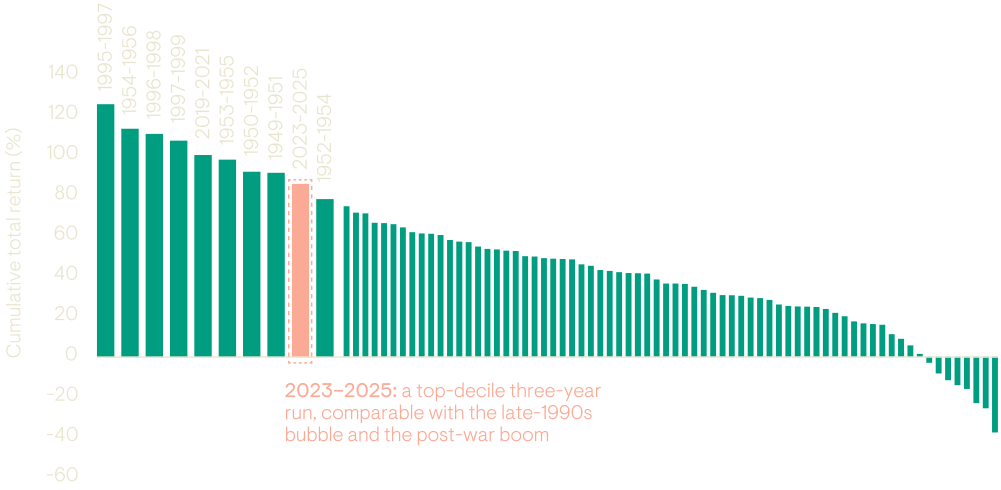
Source: Bloomberg/S&P as of December 2025. The chart shows all rolling three-year periods between 1945 and 2025. The ten highest-returning periods, drawn from the 1950s, 1990s, and the three years to 2021 and 2025, are labelled individually; the remaining periods are left unlabelled to show where the current run sits within the full historical distribution.
Booms like this usually come with a familiar set of warning signs: stretched valuations, narrow market leadership/high concentration, and high dispersion. This one is no different. So investors are naturally asking how much longer it can run. Bullish investors point to the arrival of a major general purpose technology, strong private sector balance sheets and a multi-year capex cycle underpinning nominal GDP growth. Bears point to generationally high valuations, a steady build-up of risk in markets, high uncertainty around AI unit economics, funding and supply chain viability.
The one warning sign that’s been missing
One sign of a market top has been conspicuously absent: companies and their owners have not been rushing to sell stock to the public. There is a certain intuitive (if cynical) logic to this. When the people who know a business best (founders, employees, early backers, the company itself) decide the time has come to sell shares rather than buy them, it is rarely, if ever, because they think the shares are cheap.
History bears this out. As Figure 2 shows, IPO proceeds and first-day returns have moved together since 1980, spiking hardest in 1999 and 2000, when there were 856 US operating-company IPOs, with an average first-day return of 64.6%, compared with an average of 19% over 1980-2025. Annual proceeds reached US$65 billion, compared with an average of US$25 billion from 1990-1998. That was not a normal financing market, rather public equity absorbing huge new speculative supply at euphoric prices. Investors who bought into that IPO wave underperformed for years.
Figure 2: US IPO proceeds and first-day returns, 1980-2025
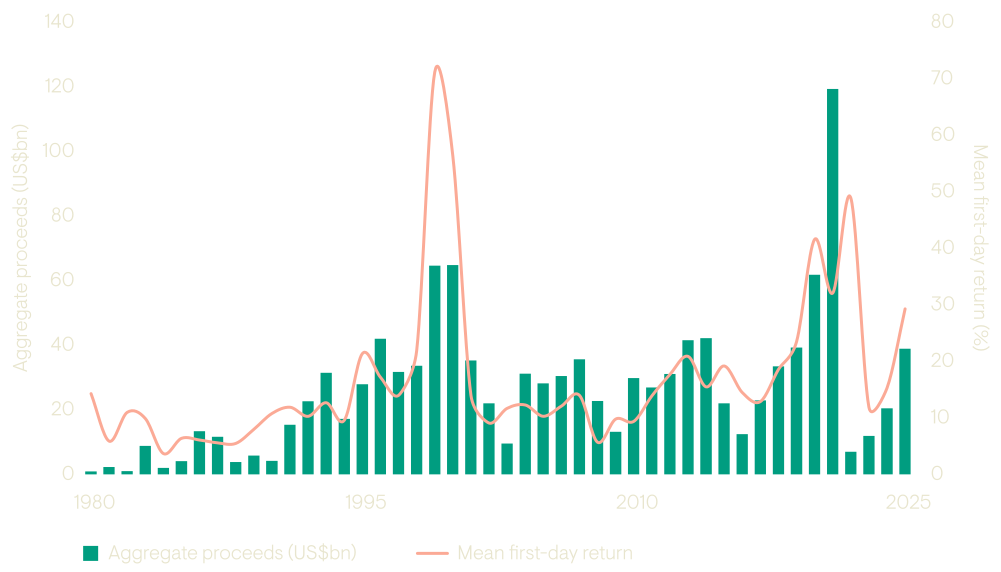
Source: Jay R. Ritter, IPO Statistics (17 March 2026). Sample includes IPOs with offer price ≥$5.00, excluding ADRs, unit offers, SPACs, closed-end funds, REITs, natural resource LPs, small best efforts offers, banks and S&Ls, and stocks not listed on CRSP.
Until very recently, today’s market looked nothing like that. New stock issuance has been muted, while companies have kept buying back their own shares (de-equitisation). That combination shows up in the index divisor, which tracks how many shares are available to buy across the whole market and breaks down into three parts: buybacks, secondary issuance, and index entries and exits, chiefly IPOs. When companies buy back stock, the divisor shrinks and gives returns a small boost; when they issue new stock through either of the other two channels, it grows and acts as a drag. (The paper uses "divisor" and "market composition" interchangeably throughout this paper.)
Between 2015 and 2025, this shrinking supply of shares added roughly 0.7% a year to US returns. At the height of the dot-com bubble, by contrast, a flood of new stock dragged returns down by as much as 10% a year (see Figure 3). As recently as May 2026, before the current wave of AI listings, this measure was flat, a strong argument that, however frothy things looked, the market wasn’t yet in bubble territory.
Figure 3: Shrinking share counts adding to returns in the US equity market
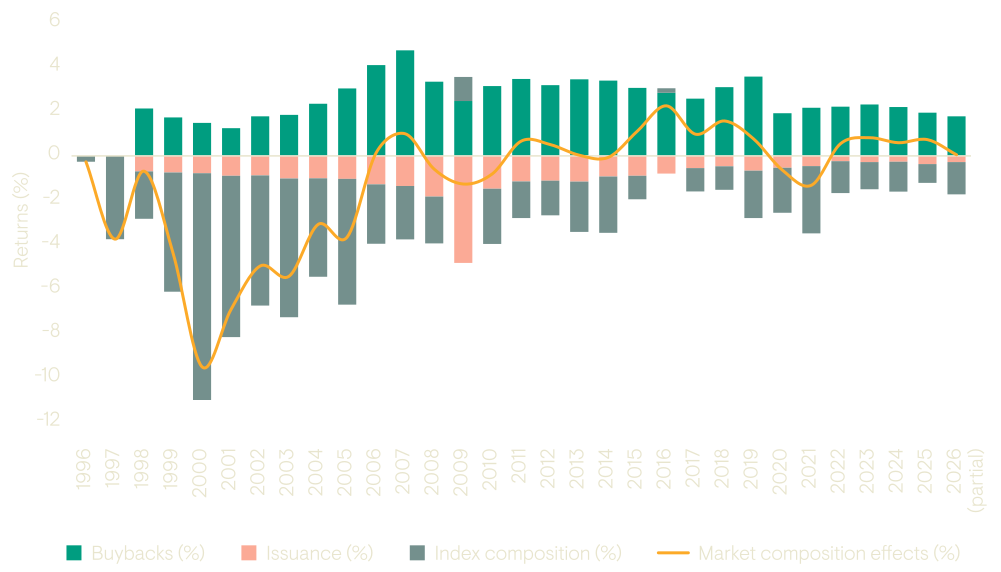
Source: MSCI, Ninety One, June 2026.
That’s now changing fast. SpaceX, OpenAI and Anthropic have all filed a listing or signalled an intent to list, three loss-making companies seeking a combined valuation of close to US$4 trillion. SpaceX began trading on 12 June. Alphabet, which had not issued equity in two decades, raised around US$85 billion to fund its build-out. Oracle has confirmed it plans to raise US$40 billion, half equity and half debt.
IPOs rarely arrive alone: a wave that starts at the top has historically dragged hundreds of smaller, typically lower-quality issuers in behind it, and we may yet see that effect play out. Researchers Lowry and Schwert show that IPO markets move in cycles: periods of high initial returns are followed by increased IPO volume – in other words, hot IPO performance invites more issuance1. So after years of asking where all the IPOs had gone, investors are about to get their answer.
Can the market absorb it?
The question gripping the market is whether it can absorb all this. In the short-term, it is difficult to call a market top with purely issuance-based signals. After all, five years passed between the 1995 Netscape IPO and the bear market that began in 2000.
Figure 4: The Nasdaq Composite and US IPO statistics before the dot-com crash
First-day IPO returns for landmark listings, plotted against the Nasdaq's rise and fall, 1990-2002
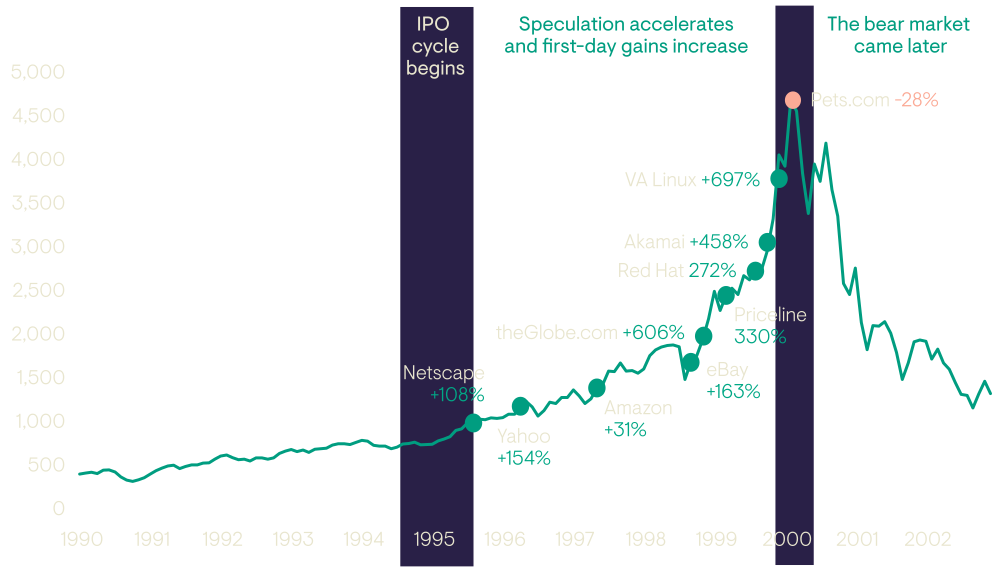
Source: NASDAQ Composite, FRED, Federal Reserve Bank of St. Louis.
The US equity market is a very deep pool of capital, about US$75 trillion worth and even several huge IPOs will not disrupt that all at once. Moreover, some of the issuance will be funded with debt rather than equity given relatively healthy corporate balance sheets.
On the other hand, a vast expansion of tradable securities in the equity market is clearly relevant to any allocator setting long-term return expectations. There is just more supply.
More supply matters more than a simple tally of dollars suggests, because of how equity markets actually absorb it. The textbook view holds that demand for equities is highly elastic: arbitrageurs trade against any mispricing, so inflows and outflows barely move prices. The "inelastic markets hypothesis," advanced by Xavier Gabaix and Ralph Koijen, argues the opposite is closer to the truth. Most US shares are held by index funds, pension funds and insurers operating under mandates that fix their equity weights within narrow bands, leaving few genuinely price-sensitive buyers. Gabaix and Koijen estimate that a dollar of new money flowing into the market can lift its total value by around five dollars, and the effect is symmetric: a dollar of net new supply should depress it by a similar order of magnitude.
This is why de-equitisation's tailwind over the past decade and the issuance headwind now arriving are not two separate stories, but one force running in opposite directions. For twenty years, that inelasticity worked in US equity holders' favour, as a shrinking pool of shares met a wall of demand that had nowhere else to go. The same mechanism is what now threatens to work against them, and why the market may be underpricing how much the reversal could move prices once it takes hold.
What does the IPO wave mean for expected future returns of US equities?
Swapping buybacks for issuance raises the bar for earnings. A company buying back stock can grow earnings per share even with flat aggregate profits, since the same profit pool is split among fewer shares. A company, or an index, adding shares must do the reverse: aggregate earnings need to grow faster just to hold per-share metrics steady, let alone lift them.
That bar is already high. Consensus estimates have megacap free cash flow staging a steep recovery by 2029 and 2030 as the AI capex drag fades (Figure 5), for the very companies now issuing shares to fund that capex. If free cash flow disappoints, or further issuance is needed to bridge the gap, today's valuations have little margin for error.
The timing compounds it. The buybacks that flattered US returns for two decades are fading just as cash moves into a far less predictable technology bet, raising the dispersion and tail risk of future returns.
Figure 5: The AI investment cycle raises the bar for future free cash flows (US$bn)
Analysts expect megacap free cash flow to surge by 2030, leaving little room for disappointment
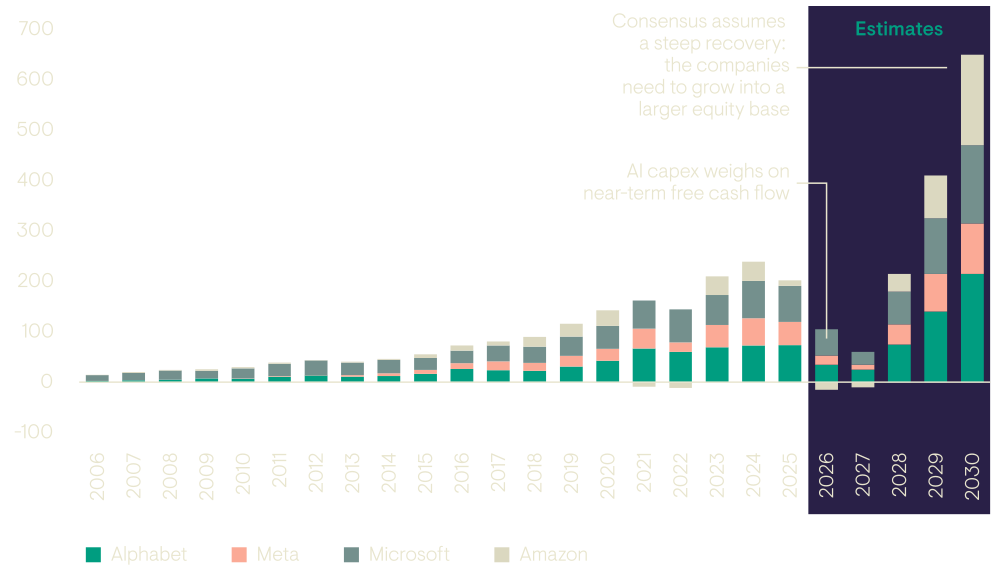
Source: Bloomberg. Actuals 2006-2025, consensus estimates 2026-2030. Calendar-year (Dec-31) aligned, US$bn.
Understanding the scenarios
We start with our Capital Market Assumptions (CMAs) framework. CMAs are ten-year forecasts of equity returns, built from four components:
- Income is the dividend yield the index pays today.
- Growth captures how much corporate revenues and earnings should expand over the decade, broadly tracking nominal economic growth.
- Revaluation asks whether today’s valuations (cyclically adjusted price-to-dividend multiples) are likely to rise, fall or stay flat relative to history. Since US equities are currently expensive by most measures, this term is negative, acting as a drag that partially offsets the income and growth contributions.
- Market composition (index divisor) is the fourth term. It measures the effect of shares entering and leaving the index over time: when buybacks shrink the share count, this adds to returns; when new issuance swells the share count, it subtracts.
As of April 2026, those four components sum to a ten-year expected US equity return of 2.7% a year in local currency, already modest by historical standards.
To gauge how much the AI listings boom could change that picture, we ran three scenarios, each one swapping in a different historical rate for “market composition” while leaving the other three return drivers unchanged.
In the base scenario, recent trends continue. Market composition impacts contribute about +0.4% a year to returns: net buybacks continue, IPOs don’t make much of an impact, de-equitisation merely pauses, the IPO wave is absorbed and the US return assumption consequently holds near 2.7% p.a.
The second scenario assumes that the period since 2006, in which US corporates steadily reduced their own share count, more than offsetting secondary issuance and index entries and exits, is an anomaly, not a rule of nature. Using a longer-run dataset and assuming a century average for market composition of -2.1%, this pushes ten-year US returns to +0.2%.
The third scenario assumes that market composition effects mimic their bubble period levels from 1995 to 2005, detracting from returns by around 4.5% a year. In that scenario, US returns over the next ten years are dire, falling to roughly -2.2% p.a. (although US returns from 1995 to 2005 were positive, the reason this level of reduction from market composition effects will be negative today is because of higher starting valuations).
Figure 6: US equities 10-year expected return under three market-composition scenarios
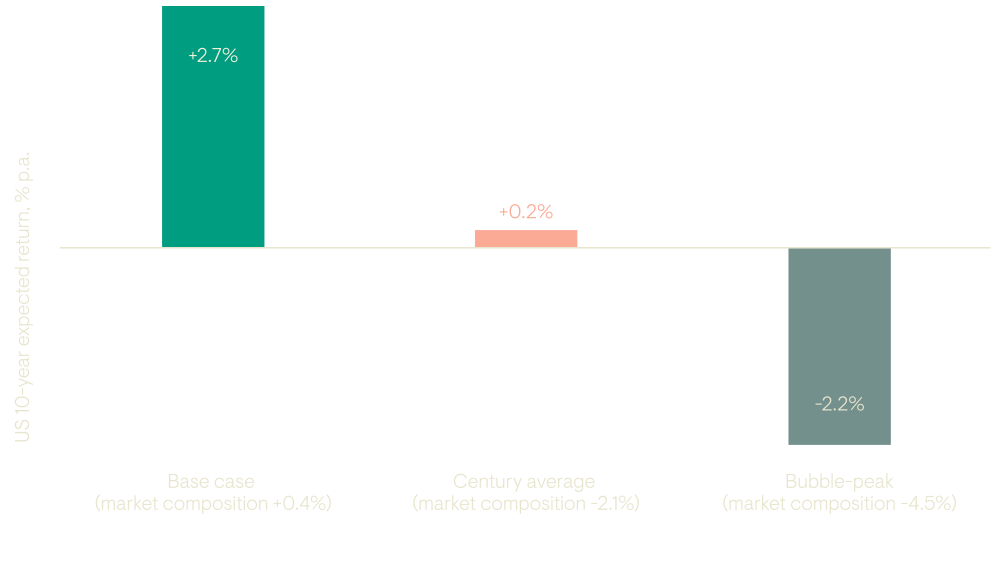
Source: Ninety One Capital Market Assumptions. Scenarios anchored to the recent pace of net issuance, the century US average, and prior bubble-peak readings. For illustrative purposes only.
These are annual effects over a ten-year period and they take time to play out. Crucially, the market composition impact numbers in the three scenarios differ less in the size of the initial issuance than in how long the resulting supply persists and whether earnings keep pace with it. To see why, it helps to separate two things that are easily run together: the headline IPO and the years of selling that follow it.
The IPO is the small part
Let's start with magnitude. SpaceX, OpenAI and Anthropic raising US$200–250 billion at listing is around 0.3% of a ~US$75 trillion market: real money, but not enough to move it.
The bigger number comes later, once lockups expire and insiders sell, and as further capital is raised. An initial free float of around a quarter typically reaches 70% within two years2; applied to the ~US$4 trillion here, that's a 4% expansion of US public equity, last seen in 1999. The real impact lands in 2027 and later.
Figure 7: Additional equity supply could come to market as float increases post-IPO
Includes 1,960 IPOs since 2003
Even IPOs launched with a tight float converge on typical levels within two years
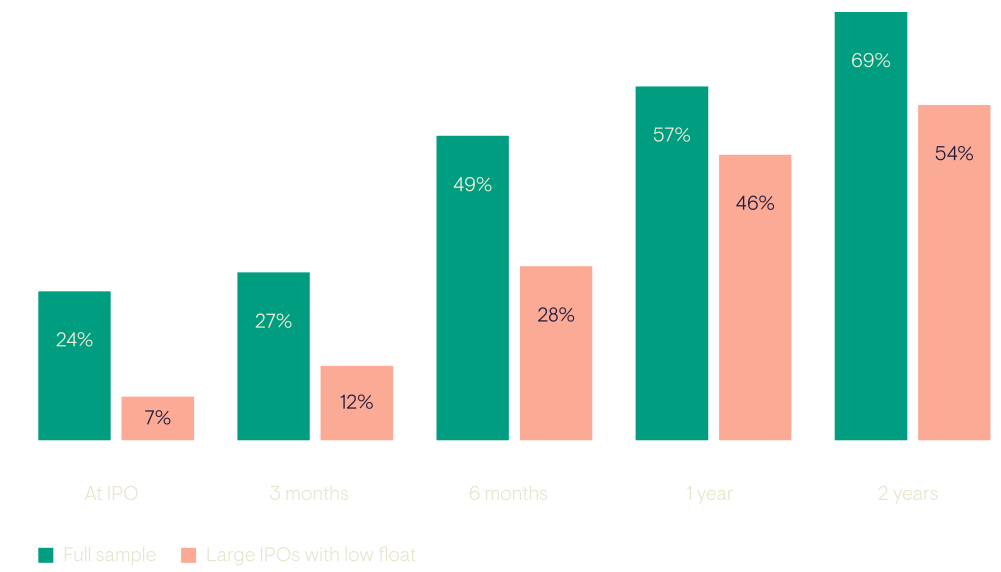
Source: Goldman Sachs Investment Research. Large IPOs with low float = 14 IPOs with deal values ≥5bp of Russell 3000 market cap and float shares <10% of total.
Two reasons the overhang could arrive sooner
This is the sequence that ended the last technology boom, and it is worth being precise about the mechanism. The IPO wave of 1998–99 did not, by itself, break the market. What broke it was a series of events that included the expiry of lockups through 1999 and into 2000, as insiders who had floated small slices of their companies became free to sell the rest, and did so into a market whose appetite was already fading. Other factors were also relevant, including Fed rate hikes, the pre-Y2K IT investment wave and valuation extremes.
Two features of the present episode threaten to make that overhang arrive faster and land more squarely on price-insensitive buyers.
- Index providers are bending their own rules to admit these companies quickly: Nasdaq has dropped the 10% minimum free-float requirement that would once have kept a low-float giant out of its benchmark and added fast-track inclusion for the largest new listings.
- The deals are being structured to grow the tradable float rapidly. SpaceX, for one, replaced the standard 180-day lock-up with a staggered schedule of releases. The combination matters because index inclusion obliges passive funds to buy at whatever weight the float dictates, and a rising float means rising forced demand. Insiders are thus increasingly selling into the mechanical, price-insensitive bid that index
membership creates, after years in which the index has performed spectacularly.
An abrupt transition to equitisation
It is not just IPOs of new companies that matter; the role of existing megacap firms is changing too. The hyperscalers redirecting cash into AI infrastructure (Alphabet, Amazon, Meta and Microsoft) are collectively guided to spend in the order of US$725 billion this year3. They are precisely the firms with the balance sheet capacity to repurchase stock, and two of them (Meta and Alphabet) have already paused doing so. Yet at the index level buybacks have not fallen; our divisor measure was still contributing a positive 0.6% to returns in the last 12 months. The reason is that the cash being diverted at the hyperscalers is, for now, being replaced by record profits elsewhere in the index, much of it earned selling the picks and shovels of the build-out. The real step-down in buybacks is therefore likely to come later. The moment of maximum vulnerability for the index may be when paused buybacks coincide with peak insider selling and, should it occur, disappointing earnings. In any case, buybacks are less attractive than they were, given higher equity valuations and higher debt-funding costs.
It is worth noting, too, how far the secondary-issuance channel alone could travel. Issuance by companies already listed (the Alphabet-style raise) ran at 0.70% of US market capitalisation a year since 2010 but reached -4% in 2000. It has been a mere 20 to 30 basis points in recent years. If further incumbents funding AI follow Alphabet and Oracle into the equity market, that single line could begin to edge up to the bubble era.
Earnings growth is still key
Return to the analogy with a single company. A firm that swaps buybacks for issuance is not necessarily worse run, but it has raised the bar it has to clear: it must now generate more aggregate earnings simply to hold earnings per share steady. The same is true of the index. Admitting a cohort of large, loss-making companies mechanically dilutes index earnings per share and depresses the aggregate dividend yield in our CMAs framework. For today’s investors to be no worse off, these companies need to deliver the growth their valuations already assume.
EM (especially China) investors have seen this before
The mechanism we documented in emerging markets is the one now assembling in the US. In the 2010s, index investors were obliged to absorb a decade of dilutive inclusions, much of it Chinese and often at cyclical valuation peaks: stocks entering MSCI China were typically added at a premium averaging close to 78% in the years after 2011, up from around 15% before then (Figure 10). Market composition changes from IPOs and MSCI index inclusion events, combined with negative revaluation, erased close to five to six percentage points of return a year. In the US today, index providers’ rule-bending risks making the obligation more acute rather than less.
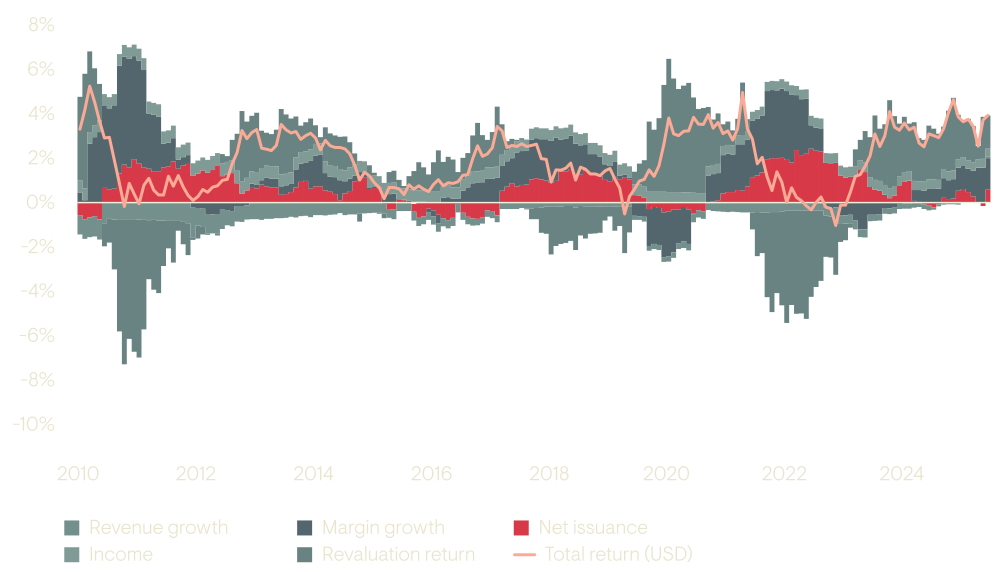
Ironically, the market-composition drag that held back emerging markets through the 2010s is now fading (Figure 8): Chinese market composition impacts have shrunk, buybacks are rising and the forced-inclusion events are behind us, even as the equivalent force builds in the United States (Figure 9). For allocators who wrote off emerging markets because the fundamentals never showed up in performance and who leaned into US equities on the strength of the past decade’s returns, that crossing-over is reason to look hard at both.
Figure 8: China: the composition drag is behind it
MSCI China two-year rolling sources of return, 2010–2024
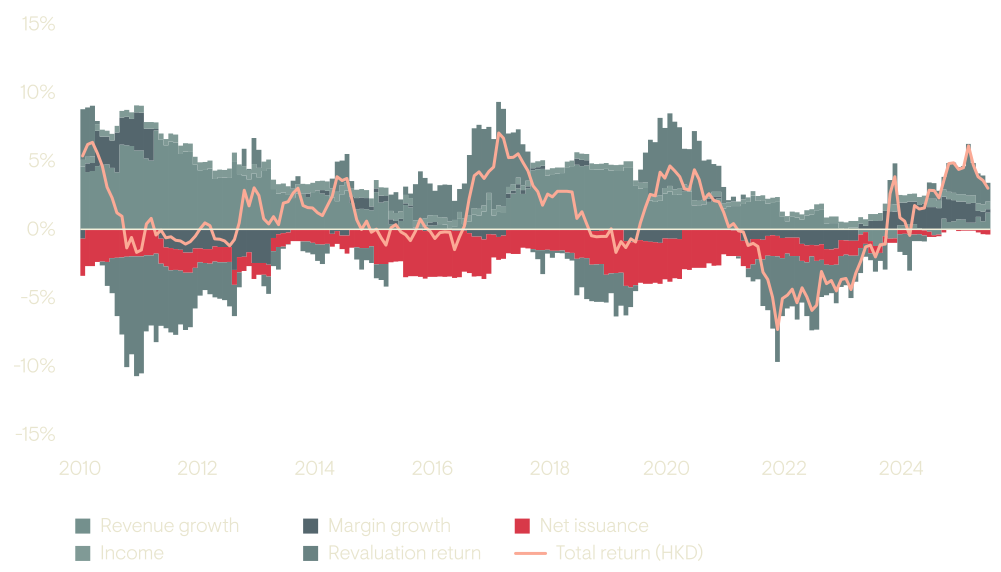
Source: Bloomberg.
Figure 9: The US: the composition drag is ahead of it
MSCI USA two-year rolling sources of return, 2010–2024
Source: Bloomberg.
Figure 10: Premium/discount on stocks entering MSCI China
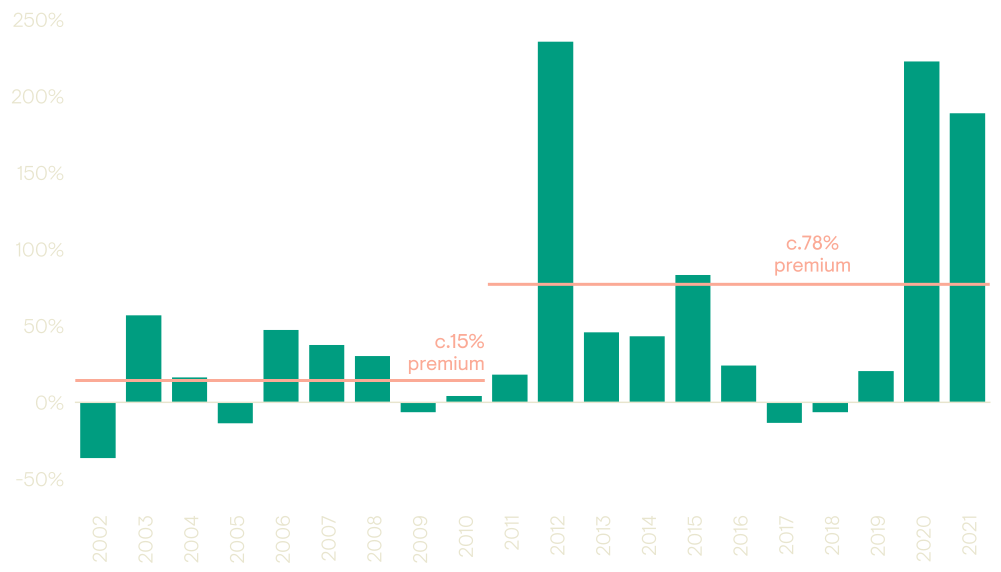
Source: Ninety One calculations, FactSet, MSCI and Goldman Sachs Global Investment Research.
Conclusion
The wave of AI listings will not, on its own, end the bull market; the US market is far too deep and calling a top from issuance alone has humbled better forecasters than us. But that is the wrong timescale on which to worry. The real question is what a sustained reversal of de-equitisation does to a decade of compounding. On our framework, the answer ranges from a modest trimming of an already modest 2.7% to flat returns, or even negative returns. The decisive variables are not the size of the first deals but the persistence of the supply that follows (an overhang that resolves itself in 2027 and 2028) and whether the companies now joining the index deliver the growth their prices demand.
What is clear is that the de-equitisation that underwrote this bull market is ending. Over the next ten years, US equity returns are going to have to come from elsewhere.
Where that elsewhere might be is not a rhetorical question, and the last decade in emerging markets offers a clue. What held EM back for so long was not an absence of growth but a surfeit of shares: forced-inclusion flows kept adding supply faster than earnings could catch up. That surfeit is now correcting, as IPOs slow and buybacks rise, and China’s composition drag has faded in step. The US spent the same decade in the opposite regime, scarcity rather than abundance, and it is that scarcity which the wave of AI-related listings is only now starting to unwind. In other words, the mechanism behind both markets’ returns may be changing sides at once. An allocator who spent the 2010s underweighting emerging markets because the fundamentals never showed up in the returns should at least ask whether it was the mechanism, not the fundamentals, doing most of the work.
Download PDF
1 https://www.nber.org/papers/w7935
2 Goldman Sachs Investment Research
3 Source: company filings, Financial Times
