Without China, the three largest markets in the MSCI EM ex-China Index are Taiwan, India, and South Korea, which together account for roughly 67%3 of the index: Taiwan (~26%), driven by TSMC’s dominance in the semiconductor4 industry; India (~25%): anchored by major banks such as HDFC Bank and ICICI Bank, alongside tech giants; and South Korea (~15%) represented by the influential Samsung chaebol and SK Hynix.
As a result, emerging Asia remains the dominant region in EM ex-China, accounting for around 72% of the index — approximately 8% lower than its weighting in the traditional MSCI EM benchmark (which includes China).
For investors, this still means substantial exposure to Asia’s manufacturing and technology powerhouses and India’s domestic growth story.
Outside Asia, EM ex-China offers greater exposure to markets in EMEA (Europe, the Middle East, and Africa) and Latin America. Without China, markets like Saudi Arabia, South Africa, Brazil, and Mexico take on a more prominent role in the index, adding to regional diversification.
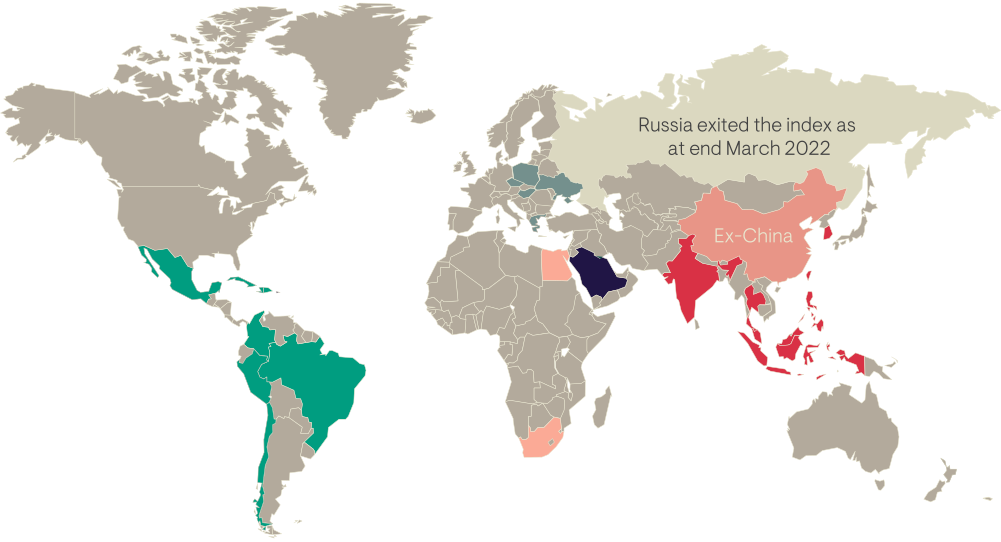
Below we illustrate the regional allocations within the MSCI EM ex-China Index, and highlight how this allocation has either increased or decreased relative to the traditional MSCI EM Index.
Figure 2: Regional allocation ex-China
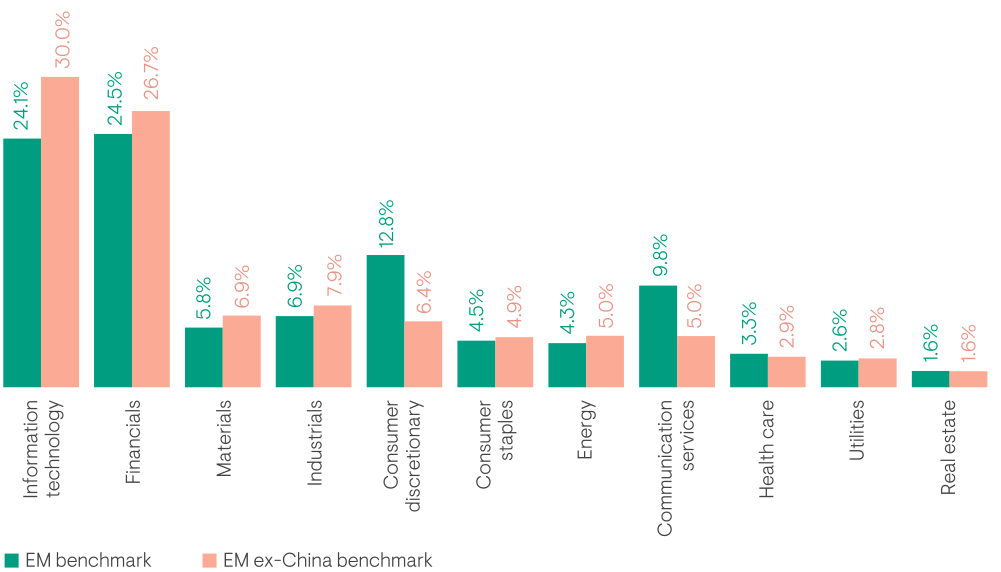
Removing China from the EM index leads to notable shifts in sector weights. Information technology takes on a larger role, driven by Taiwan’s TSMC5 and South Korea’s tech hardware firms. Financials also gain slightly in prominence. Sectors heavily represented by Chinese companies, such as communication services and consumer discretionary (including internet and e-commerce), see their weights decrease. In contrast, materials, energy, and consumer staples increase their relative index share.
This shift brings a different set of industry leaders to the fore, from India’s banks and IT services firms to commodity exporters in Latin America and the Middle East. The rise in information technology exposure also reflects a broader trend: a growing number of innovative digital businesses across India, South Korea, and Latin America.
The net effect is that EM ex-China has a different sector mix but still spans a broad range of industries, from manufacturing and semiconductors to banks, energy, and consumer goods.
Figure 3: EM vs. EM ex-China sector allocation side by side
Source: Ninety One, as at 30 June 2025.
Outside of the index
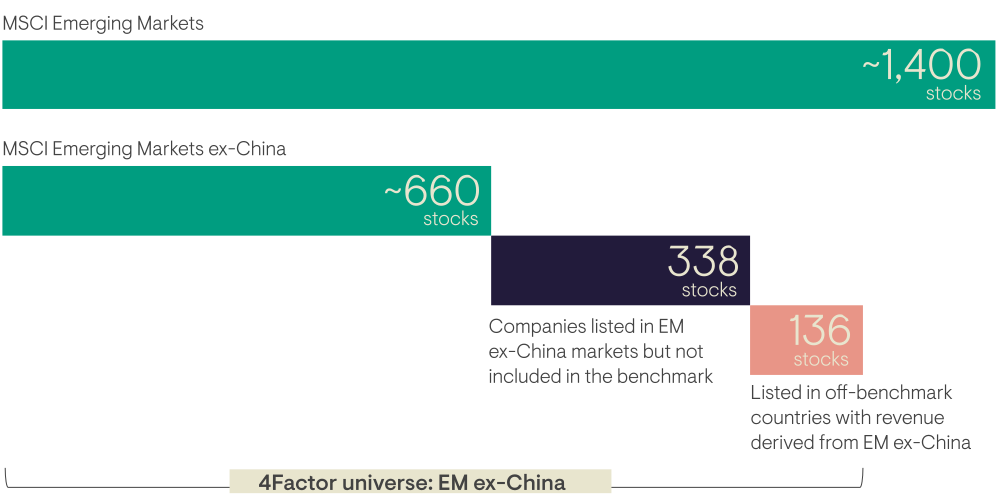
For active investors, it is worth noting that many attractive EM ex-China companies lie beyond the standard index definitions. The MSCI EM Index comprises around 1,400 stocks, whereas the MSCI EM ex-China Index has approximately 660 constituents, reflecting the removal of about 740 Chinese listings (see Figure 4). This smaller index universe could concern investors who worry about breadth. Traditional EM indices also exclude companies headquartered in emerging markets but listed on developed market exchanges, and miss many smaller-cap EM companies.
By broadening the investment universe to include off-benchmark names – including companies listed in EM countries that do not meet index inclusion criteria, or companies listed outside EM that derive more than 50% of their revenues from EM ex-China – the investable universe grows considerably. For example, Singapore-listed Sea Ltd6, which operates in e-commerce and gaming across Southeast Asia, is not in the EM ex-China index but is a legitimate investment candidate for an active EM ex-China strategy. Using this wider lens, the investable universe expands to nearly 1,130 stocks, comparable in breadth to the full EM index.
Figure 4: Full EM ex-China universe
Source: Ninety One, 30 June 2025.
Liquidity is an important factor for investors building high-conviction positions. While China is the most liquid market in the EM universe, the EM ex-China opportunity set is large and liquid enough to construct and manage conviction-driven portfolios without restraint. As of the latest data, EM ex-China’s total market capitalisation is about US$6.2 trillion7, with an average company size of US$9.7 billion. For comparison, the MSCI Emerging Markets Index has a total market cap of US$8.7 trillion, with an average company size of US$7.2 billion. This means that, once China’s many mid-sized companies are removed, the average EM ex-China stock is larger (and often more liquid) than the average EM stock.
Moreover, the concentration profile of the EM ex-China market is similar to that of the broad EM index, including China, where the top 10 constituents comprise roughly 26-29% of the index in both cases (Table 1). In other words, EM ex-China is not significantly more top-heavy or less diversified than broad EM.
Table 1: Similar concentration profiles in EM and EM ex-China universe
| Emerging markets |
| Top 10 constituents |
Country |
Float adj mkt cap (US$bn) |
Index wt. (%) |
Sector |
| Taiwan Semiconductor |
TW |
807.81 |
10.54 |
IT |
| Tencent Holdings |
CN |
348.70 |
4.55 |
Comms Serv |
| Alibaba |
CN |
172.76 |
2.25 |
Cons Disc |
| Samsung Electronics |
KR |
172.59 |
2.25 |
IT |
| HDFC Bank |
IN |
116.93 |
1.53 |
Financials |
| Meituan B |
CN |
96.70 |
1.26 |
Cons Disc |
| Reliance Industries |
IN |
86.45 |
1.13 |
Energy |
| China Construction BK H |
CN |
80.22 |
1.05 |
Financials |
| ICICI Bank |
IN |
78.06 |
1.02 |
Financials |
| Infosys |
IN |
72.94 |
0.95 |
IT |
| Total |
|
2,033.17 |
26.52 |
|
| Emerging markets ex-China |
| Top 10 constituents |
Country |
Float adj mkt cap (US$bn) |
Index wt. (%) |
Sector |
| Taiwan Semiconductor |
TW |
807.81 |
14.59 |
IT |
| Samsung Electronics |
KR |
172.59 |
3.12 |
IT |
| HDFC Bank |
IN |
116.93 |
2.11 |
Financials |
| Reliance Industries |
IN |
86.45 |
1.56 |
Energy |
| ICICI Bank |
IN |
78.06 |
1.41 |
Financials |
| Infosys |
IN |
72.94 |
1.32 |
IT |
| Hon Hai Precision |
TW |
70.02 |
1.26 |
IT |
| Mediatek |
TW |
65.67 |
1.19 |
IT |
| SK Hynix |
KR |
64.50 |
1.17 |
IT |
| Al Rajhi Banking |
SA |
49.35 |
0.89 |
Financials |
| Total |
|
1,584.33 |
28.62 |
|
Source: MSCI, as at 30 June 2025.
Note re market abbreviations: TW = Taiwan, CN = China, KR = South Korea, IN = India, BR = Brazil, SA = Saudi Arabia.
It is also instructive to look at history. When MSCI introduced Asia ex-Japan as a separate index in 2001, investors had similar concerns about flows and average daily trade volumes. At that time, Japan represented 73% of the MSCI pan Asian Index8. However, both Japan and ex-Japan continued to attract healthy capital flows post-split, so we can surmise that both EM ex-China and China can attract flows if the underlying fundamentals remain intact.
Perhaps the most critical question is whether excluding China materially changes the risk-return profile for investors. Our analysis shows that EM ex-China fundamentals remain attractive and, unsurprisingly, are very similar to those of the broader EM asset class.
Table 2: Comparing asset class fundamentals
| Fundamentals |
MSCI EM |
MSCI EM ex-China |
MSCI China |
| EPS Growth (2022-24 CAGR) |
13.1% |
13.9% |
11.4% |
| 12m PE (x) |
15.1x |
15.9x |
13.3x |
| PEG (past 5 yr avg) |
1.0x |
1.1x |
1.0x |
| ROE (past 5 yr avg) |
12.1% |
12.8% |
10.8% |
| EPS (past 5yr avg) |
13.6% |
12.6% |
16.1% |
Source: FactSet, MSCI, Goldman Sachs Global Investment Research, 30 June 2025.
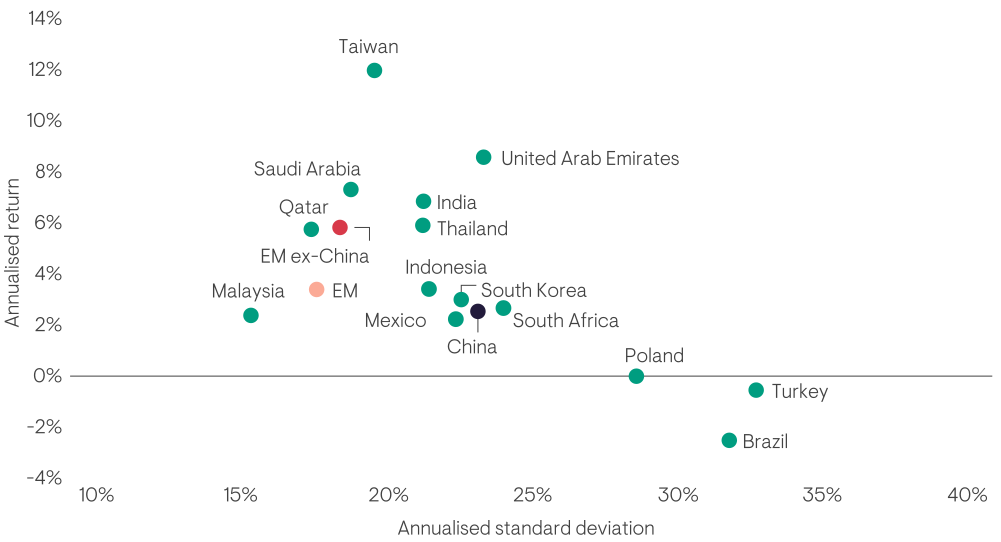
EM ex-China offers a slightly higher return potential with only a modest increase in risk. In practice, removing China does not mean forfeiting returns or taking on excessive risk – the rest of EM can provide enough balance to compensate for it. This is because EM ex-China spans more than 20 diverse countries, where different economic cycles often offset one another. Importantly, valuation and growth metrics remain closely in line with the broader EM universe.
Figure 5: EM ex-China has similar risk-return characteristics to EM
Source: FactSet, MSCI, Morgan Stanley Research. Monthly USD total gross return data as at December 2024. This analysis includes only top 15 largest markets in MSCI EM.
3 Figures on this page refer to the MSCI Emerging Market Index, as at 30 June 2025.
4 This is not a buy, sell or hold recommendation.
5 This is not a buy, sell or hold recommendation.
6 No representation is being made that any investment will or is likely to achieve profits or losses similar to those achieved in the past, or that significant losses will be avoided.
Source: MSCI, Ninety One, 30 June 2025. These internal parameters are subject to change not necessarily with prior notification. This is not a buy, sell or hold recommendation for any particular security. For further information on specific portfolio names and how the overall strategy performed, please see the Important information section. For further information on indices, please see the Important information section.
7 MSCI EM ex-China as at 30 June 2025.
8 FactSet, MSCI, Goldman Sachs Investment Research.