Get to know 4Factor Emerging Markets Equity
A core strategy seeking to generate alpha across emerging market cycles
Emerging markets (EM) equities have continued their impressive rally in 2026, shrugging off headwinds including the conflict in the Middle East, sharply oscillating commodity prices and inflationary concerns. Through July, the MSCI EM index rose by 20%1, exceeding other major indices, even the tech-focused Nasdaq. This outperformance in fact goes back to the start of 2025, with EM equities returning 60% over this period, close to double what developed markets delivered. However, it has been rightly noted that this asset class strength has been narrow, concentrated in a handful of Asian technology companies at the heart of the AI cycle, raising the question around its durability. In this paper, we will seek to allay these concerns, explaining the key reasons we remain positive regarding the outlook for EM equity investing.
It has been a concentrated market, with 81% of index returns in the second quarter of this year coming from just 10 stocks, drawing parallels to the market concentration observed during the Covid-era in 2020, when the top 10 contributed 86% of EM returns2. The underlying driver of index returns, however, has been earnings growth, rather than multiple expansion. Admittedly, on a year-to-date basis this has been led by technology names, but this breakout in earnings is spurring a breakout in the market. Consensus estimates predict further increases in emerging market EPS over the next two years, which bodes well for the asset class, as EPS trends have historically provided a reliable link to equity returns.
Figure 1: EM outperformance has been led by earnings, rather than multiple expansion
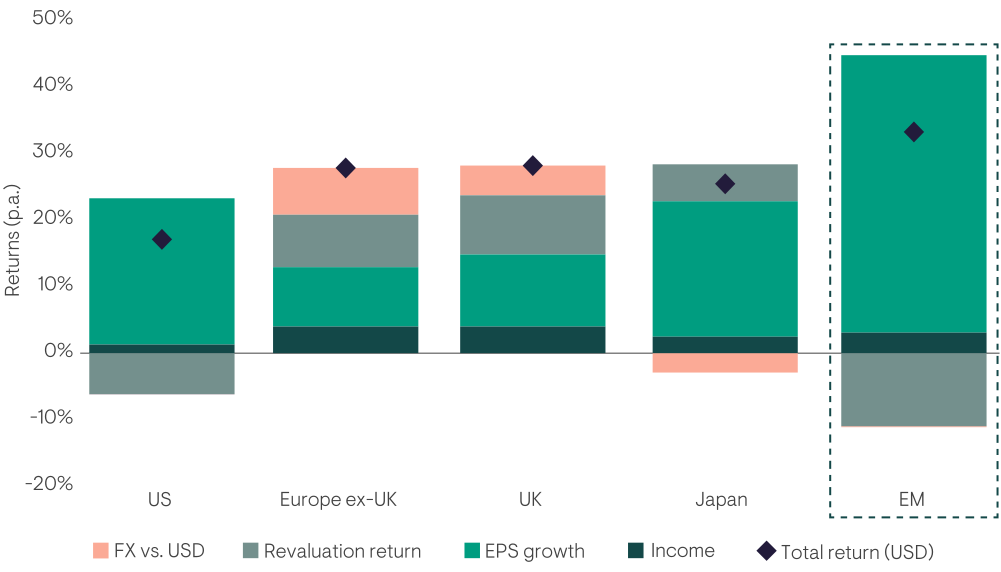
Source: Bloomberg, January 2025 to July 2026.
Figure 2: EPS trends have historically provided a reliable link to equity returns
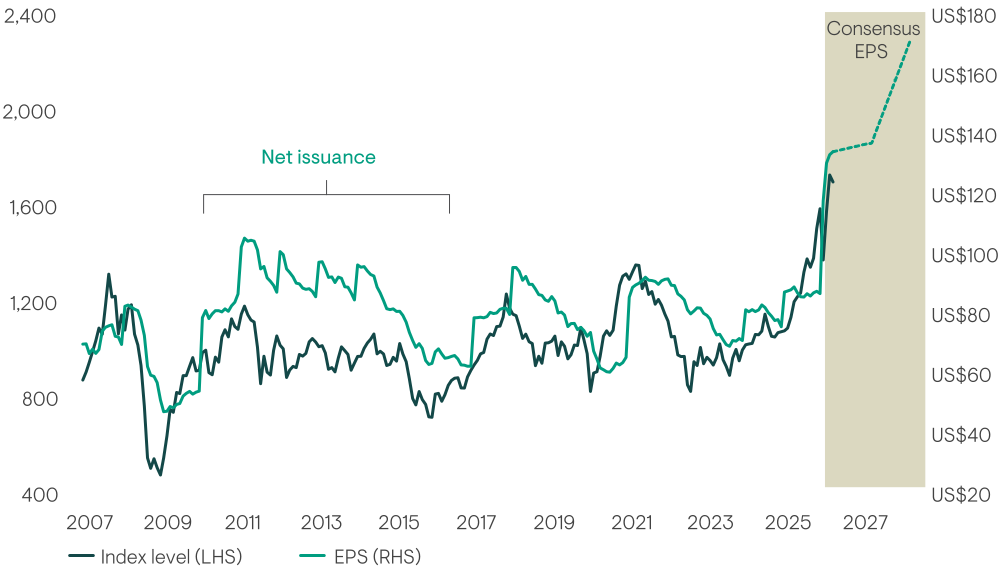
Source: Bloomberg, Ninety One, June 2026.
EM companies are expected to deliver EPS growth of 23.4%3 over the next two years, leading every other major region. More importantly, the composition of that growth is broadening; sector earnings contribution data shows that, while technology remains responsible for a meaningful portion of earnings growth, we are seeing signs of growth diversifying beyond technology. For instance, a much greater contribution is expected from consumer discretionary, industrials and financials, so while recent return concentration has been high, the earnings support behind future returns is expected to widen.
Figure 3: A broader set of sectors are beginning to share EM’s earnings growth
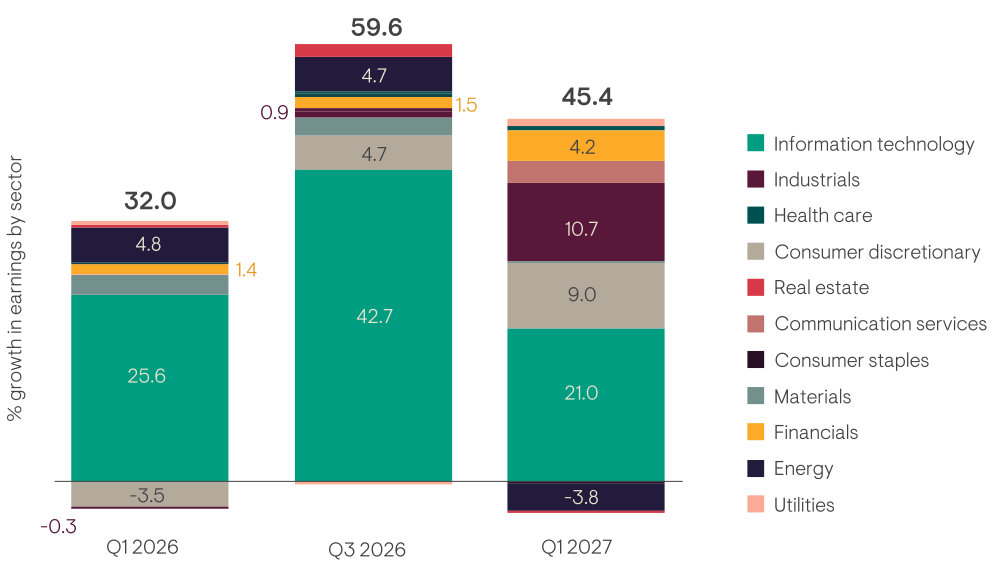
Source: Ninety One, FactSet, MSCI EM Earnings Scorecard, data as at 17 July 2026. Q2’26 onward reflects analyst consensus estimates, not reported results.
Despite the rally, the MSCI EM index still trades at a meaningful discount to the MSCI World on both a P/E and P/B basis, and this discount is yet more extreme when compared to the US. Strikingly, the current EM-to-US valuation spread sits in the top quintile of historical observations going back 30 years, with periods of this degree of EM discount having historically been followed by strong EM outperformance over subsequent three/five-year windows. Combined with what we believe to be a peaking US dollar, which has preceded the last two near decade-long cycles where EM outperformed DM, we suggest these forces argue for a fresh look at exposure to the asset class.
Figure 4: Despite the recent re-rating, EM’s discount to developed markets remains wide
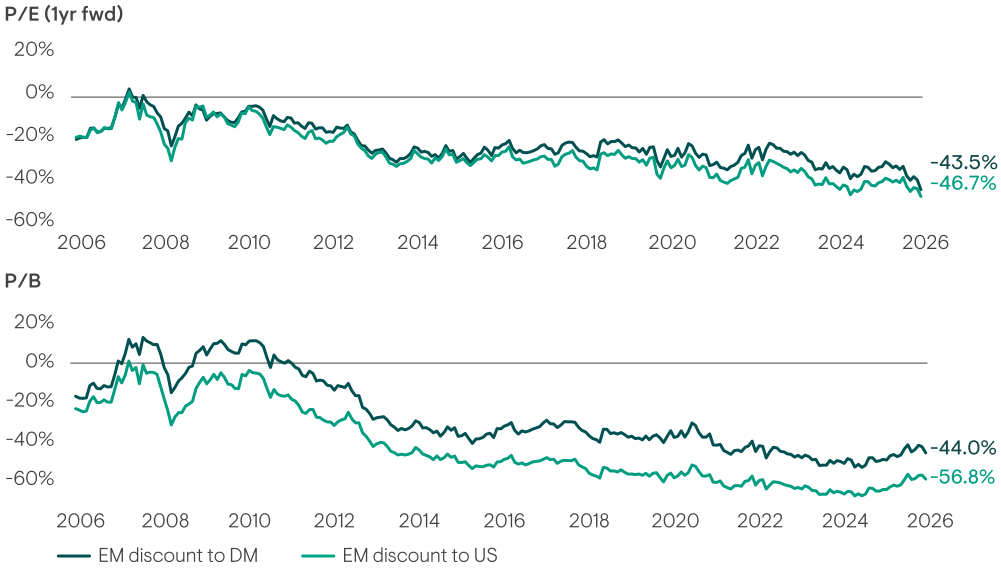
Source: Factset, Ninety One. 31 July 2026.
Investors are catching on, pouring in US$46.4 billion to EM equities in the first half of this year, more than the annual average over the last five calendar years, bringing net flows to nearly US$90 billion over the last 12 months4. Flows reflect early signs of a turning tide, in light of a more supportive dollar backdrop and investor appetite to diversify away from concentrated US exposure. This has been reinforced by stronger fundamentals, including more credible monetary policy, healthier currency reserves and corporate quality, alongside structural growth tailwinds, not least its role in the technology supply chain. EM possesses some of the biggest companies in the tech space, which have come to dominate a transformed universe in recent years.
Comparing the MSCI EM index’s top 10 constituents in 2010 versus today is telling: in 2010 the list was dominated by state-owned oil, mining, telecom and bank names, with a combined weight of 18.3%. Today’s top 10 carries 41.0% in weight but consists entirely of privately-run businesses with no state ownership. This trend represents a genuine improvement in governance quality and competitive positioning in the opportunity set. We believe that when viewing the characteristics of EM through this lens, the ‘risk’ is concentrated in higher-quality businesses than the index has ever contained, with positive spillover effects across the universe.
This shift in composition quality is also evident in profitability. In 2010 the 10 largest constituents generated a weighted average return on equity of 23.0%, while the equivalent figure for today’s top 10 is 35.1%. Critically, this is attributable to a change in index leadership towards a cohort of structurally more profitable companies.
This increase in concentration also serves as an opportunity for active managers, who have the flexibility to be selective rather than carry indiscriminate exposure to large benchmark weights that could have an outsized impact should they de-rate.
Figure 5: The EM equity universe has significantly improved in quality
| 2010 | Weight (%) | SOE |
|---|---|---|
| Petroleo Brasileiro | 3.1 | ✓ |
| Samsung Electronics | 2.7 | |
| Vale | 2.6 | ✓ |
| Gazprom | 1.7 | ✓ |
| TSMC | 1.5 | |
| China Mobile | 1.5 | ✓ |
| America Movil | 1.5 | |
| Itau Unibanco | 1.4 | |
| Industrial and Commerical Bank of China | 1.2 | ✓ |
| China Construction Bank | 1.1 | ✓ |
| Total | 18.3 |
| Q2 2026 | Weight (%) | SOE |
|---|---|---|
| TSMC | 15.1 | |
| Samsung Electronics | 9.0 | |
| SK Hynix | 7.6 | |
| Tencent | 2.7 | |
| Alibaba Group | 1.6 | |
| Media Tek | 1.6 | |
| Delta Electronics | 1.0 | |
| SK Square | 0.8 | |
| Hon Hai Precision | 0.8 | |
| HDFC Bank | 0.8 | |
| Total | 41.0 |
Source: MSCI, Ninety One. MSCI EM Index 2010 and 30 June 2026. For further information on indices, please see the Important Information section. SOE = State Owned Enterprise.
While EM has delivered roughly double the return of developed markets since the beginning of 2025, allocation data suggests many investors remain under-weight the asset class. We would suggest that the structural improvements to a universe in which the earnings base is broadening, EM’s growth outlook is leading every other major region, and valuations remain historically cheap, presents a compelling foundation to consider. A US dollar that appears close to its peak, which has typically preceded strong EM outperformance, adds further weight, as does today’s improved EM universe quality.
Given the scale of the opportunity ahead, there is scope to capture a re-rating that we believe has considerable upside from here.
1 Source: MSCI, Bloomberg, Ninety One. 31 July 2026.
2 Source: MSCI, Ninety One. June 2026.
3 Source: MSCI, Bloomberg, Ninety One. 30 June 2026.
4 Source: Ninety One, Morningstar, June 2026
General risks. The value of investments, and any income generated from them, can fall as well as rise. Costs and charges will reduce the current and future value of investments. Past performance does not predict future returns. Investment objectives may not necessarily be achieved; losses may be made. Target returns are hypothetical returns and do not represent actual performance. Actual returns may differ significantly. Environmental, social or governance related risk events or factors, if they occur, could cause a negative impact on the value of investments.
Specific risks. Geographic/Sector: Investments may be primarily concentrated in specific countries, geographical regions and/or industry sectors. This may result in wider fluctuations in the value of the portfolio compared to more broadly invested portfolios. Emerging market: These markets carry a higher risk of financial loss than more developed markets as they may have less developed legal, political, economic or other systems. Equity investment: The value of equities (e.g. shares) and equity-related investments may vary according to company profits and future prospects as well as more general market factors. In the event of a company default (e.g. insolvency), the owners of their equity rank last in terms of any financial payment from that company.
