The global bond selloff isn't as global as it looks
Developed-market bond yields have risen together, but for very different reasons. The contrast between the UK and US shows why investors need to look beneath the headline move.
1 Nov 2023
20 minutes
Ninety One’s Capital Market Assumptions framework focuses on the key drivers of long-term performance. We do this to better understand possible future returns, enriching discussions with our clients.
Our framework emphasises income payments across asset classes, as they are both readily measured and pivotal in determining returns.
We divide returns into three components. The first – income – is a tangible, known entity, but the other two are subject to misestimation:
| 1 | Income Yield is historically the single most important explanatory factor for income-generating assets |
| 2 | Growth The extent to which income is expected to change over time |
| 3 | Revaluation The price per unit of income likely to apply at the end of the period (typically, 10 years) |

A clear divergence has emerged between fixed income assets, where prospective returns have moved towards historic average outcomes, and equities, where expected returns remain low relative to long run historic outcomes and well below the prospective returns that have been on offer at the bottom of major historic bear markets.
Our current Capital Market Assumptions (30 September 2023) remain somewhat bearish in aggregate: we anticipate that a traditional 60% global equity, 40% global government bond portfolio will deliver a 4.9% annualised return for the next decade in nominal terms, when hedged into US dollars. This is higher (0.7%) than our last update six months ago but remains markedly down from our forecasts in March 2020 in the immediate aftermath of the COVID sell-off. An increased allocation to higher risk fixed income assets would increase portfolio return expectations, at the cost of higher correlations to equities.
We continue to see a need for considerable value-add from asset allocation and security selection decisions as well as from identifying investments that will benefit from structural growth tailwinds to achieve investment objectives.
Source: Ninety One proprietary Capital Market Assumptions as at 30 September 2023.
These estimates are gross of fees (returns can be reduced by management fees and other expenses incurred) and reflect the view of Ninety One’s multi-asset team, whilst the views of other teams across Ninety One may differ. Details on our Capital Market Assumptions methodology available upon request.
Higher interest rates have lifted prospective returns for risk free assets but risk premia remain very compressed.
A clear divergence has emerged between fixed income assets, where prospective returns have moved towards historic average outcomes, and equities, where expected returns remain low relative to long run historic outcomes and well below the prospective returns that have been on offer at the bottom of major historic bear markets.
Our current Capital Market Assumptions (30 September 2023) remain somewhat bearish in aggregate: we anticipate that a traditional 60% global equity, 40% global government bond portfolio will deliver a 4.9% annualised return for the next decade in nominal terms, when hedged into US dollars. This is higher (0.7%) than our last update six months ago but remains markedly down from our forecasts in March 2020 in the immediate aftermath of the COVID sell-off. An increased allocation to higher risk fixed income assets would increase portfolio return expectations, at the cost of higher correlations to equities.
We continue to see a need for considerable value-add from asset allocation and security selection decisions as well as from identifying investments that will benefit from structural growth tailwinds to achieve investment objectives.
Source: Ninety One proprietary Capital Market Assumptions as at 30 September 2023.
These estimates are gross of fees (returns can be reduced by management fees and other expenses incurred) and reflect the view of Ninety One’s multi-asset team, whilst the views of other teams across Ninety One may differ. Details on our Capital Market Assumptions methodology available upon request.
We tend to evaluate effectiveness in terms of getting the direction of travel correct.
Long-term predictions are fraught with uncertainty and open to error. We can, however, retrospectively apply our framework to assess its historical effectiveness. Because we focus on contextual information, we tend to evaluate effectiveness in terms of the reliability of the direction of the signal at market peaks or troughs; getting the broad direction of travel correct over a decade is a critical factor in an overall investment outcome.
Figure 1 identifies a variety of market peaks and subsequent troughs, stretching back to 1980, for each of developed market equity and global bonds1. We then show the subsequent 10-year predicted returns at those points
Figure 1: Expected returns can vary significantly depending on the point of the cycle

Source: Ninety One. Data is global since 2000; prior dates based on US outcomes. Bonds based on 10-year tenor.
For example, the first point on the previous chart corresponds to November 1980 (roughly a market peak) followed by a trough in July of 1982. The relevant 10-year forecasts in each instance were:
| Peak | Subsequent trough | |
|---|---|---|
| Developed market equity | 12.4% | 18.8% |
| Global bonds | 13.7% | 13.2% |
Indeed, global equities tripled in the decade from November 1980, and rose fourfold from July 1982. The chart illustrates the desired pattern – riskier assets tend to have lower anticipated 10-year returns at peak than they do at the subsequent trough; conversely, the more defensive bond asset tends to do better at the peak than the trough. Interestingly, although this pattern is repeated over time, it does appear to be getting more compressed – perhaps due to the expansive liquidity provision over this period.
1 Developed market equities = MSCI ACWI and global bonds = FTSE WGBI.
Higher prospective returns are available in fixed income because of moves in government bond yields but the additional compensation from taking on greater credit risk has fallen yet further.
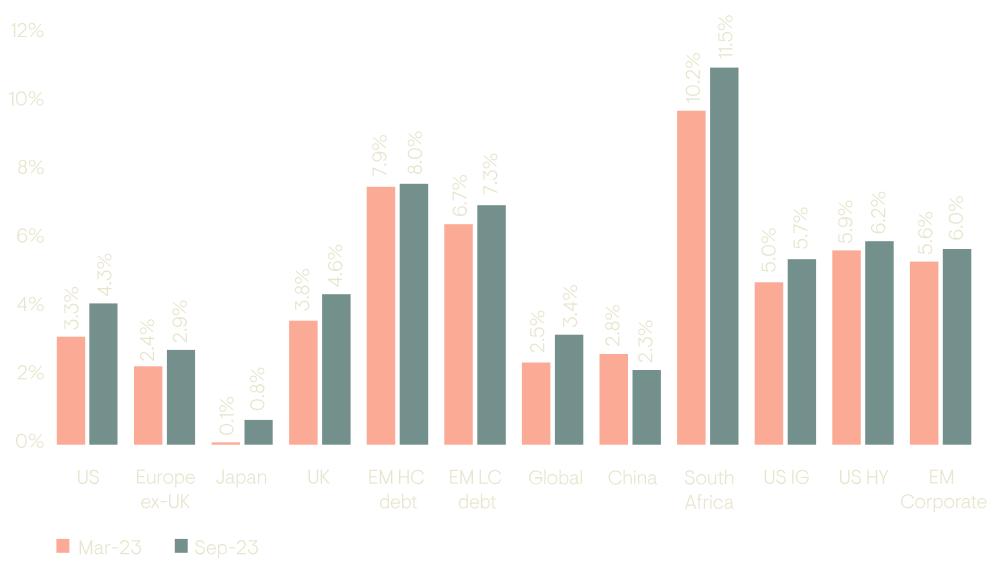
Figure 2 examines fixed income assets in nominal, local currency terms, for September 2023 versus our last update, six months ago:
Figure 2: Sovereign bond yields have increased but credit spreads have tightened, leading to modestly higher expected return
10 year local currency, log return forecast
Source: Ninety One (internal calculations based on Bloomberg and Moody's data).
The total level of income available to investors has generally increased over the last six months, although higher risk-free yields have to be set against a further compression of credit spreads.
Higher risk-free yields were initially driven by changing expectations about the path of short-term interest rates; then, towards the end of the period, market implied expectations for long run neutral rates also moved higher. This leads us to forecast an essentially unchanged revaluation loss as starting yields are still expected to revert to a higher level over the next ten years.
Tighter monetary policy means that yield curves remain inverted in most markets at the short end but relatively flat at the ten-year point. Japan and China are the exceptions with ongoing loose policy and upward sloping yield curves. In most government bond markets, there is a positive roll return available which largely offsets the expected drag from revaluation.
Credit spreads tightened significantly over the period with EM Sovereign and US High Yield spreads falling by about 75bps and EM Corporate spreads down almost 40bps.
Currency remains a critical consideration, given the ongoing strength of the US dollar, with material impacts on a conversion basis.
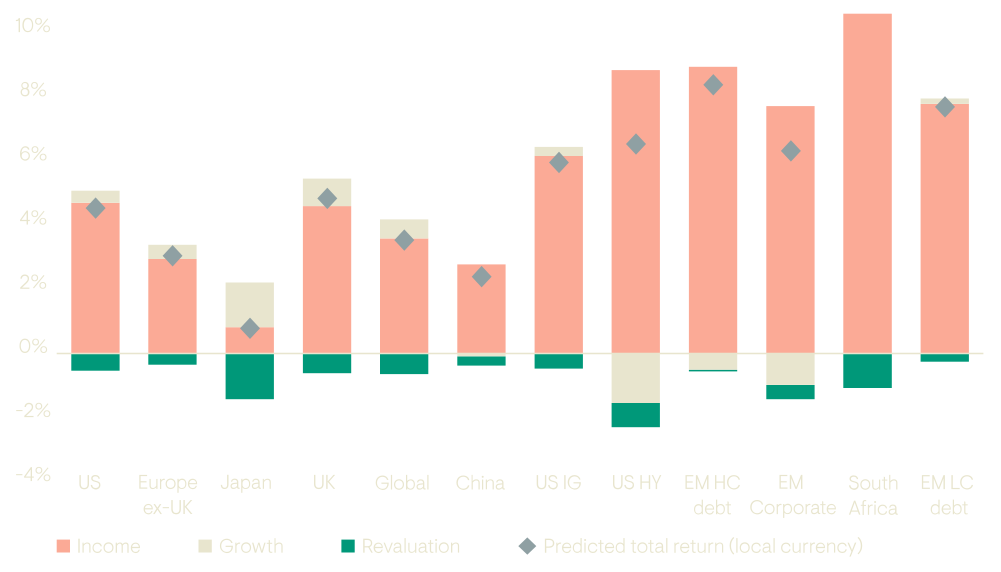
Figure 3 sets out our return forecasts in more detail, dissecting fixed income regions in the context of our Capital Market Assumptions framework pillars: income, growth, and revaluation.
Figure 3: Income accounts for the bulk of return potential across fixed income
Source: Ninety One (internal calculations based on Bloomberg and Moody’s data).
Although bonds and equities have common drivers - income, growth and valuation – their relative importance is different. What do these suggest about the future for each asset class?
Following a decade and more where zero- and negative-interest-rate-policies drove fixed income yields ever lower, the last two years have brought a historically large shift upwards across global yield curves with some of the most dramatic moves occurring in just the last few months. Faced with such a major reset in the level of bond yields, it is critical to investigate the implications of this shift for future returns and in particular the role that starting yields play in determining overall outcomes in different asset classes.
Our methodology focuses on three basic drivers of returns:
Let’s look at what history can tell us. Unfortunately, detailed market information – to enable us to decompose returns – has not been available for a very long history, and then primarily in key markets. Nonetheless, it is instructive to look at US assets to get some insight into the question.
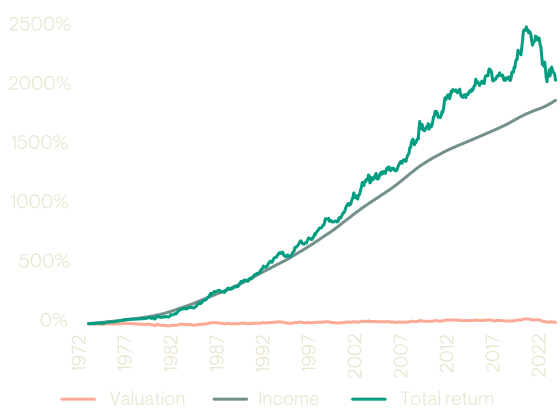
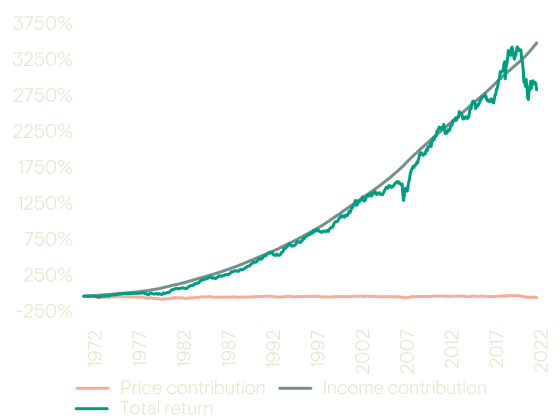
On the fixed income side, we wish to have a sense of both sovereign and credit returns, so we use the Bloomberg Treasury and Investment Grade indices. If we are content to look at only Valuation (‘price’) and Income (‘coupon’), these indices stretch back to the 70s – i.e. a full half-century. It is immediately evident in Figure 4, both in terms of government debt (left hand side) and investment grade corporates (right hand side) that income dominates returns:
Figure 4: Income dominated returns
Source: Ninety One calculations; Bloomberg Index data.
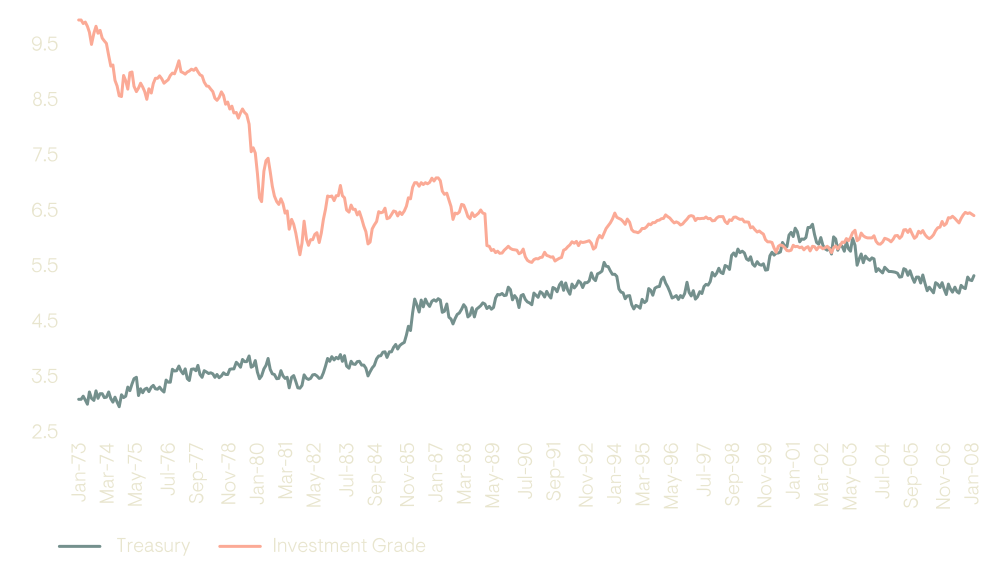
The missing detail here is the ‘Growth’ contributor, which we assume primarily relates to rebalancing effects (to maintain constant duration) and credit loss elements. We ignore the duration rebalancing for the time being (since the indices were not duration targeted, indeed duration has significantly reduced for Investment Grade from around 10-years to about seven years, while extending for Treasuries, from about three years to over six years), to focus on the credit loss component2:
Figure 5: Duration comparison of US Investment Grade versus US Treasury indices
Source: Ninety One calculations; Bloomberg Index data.
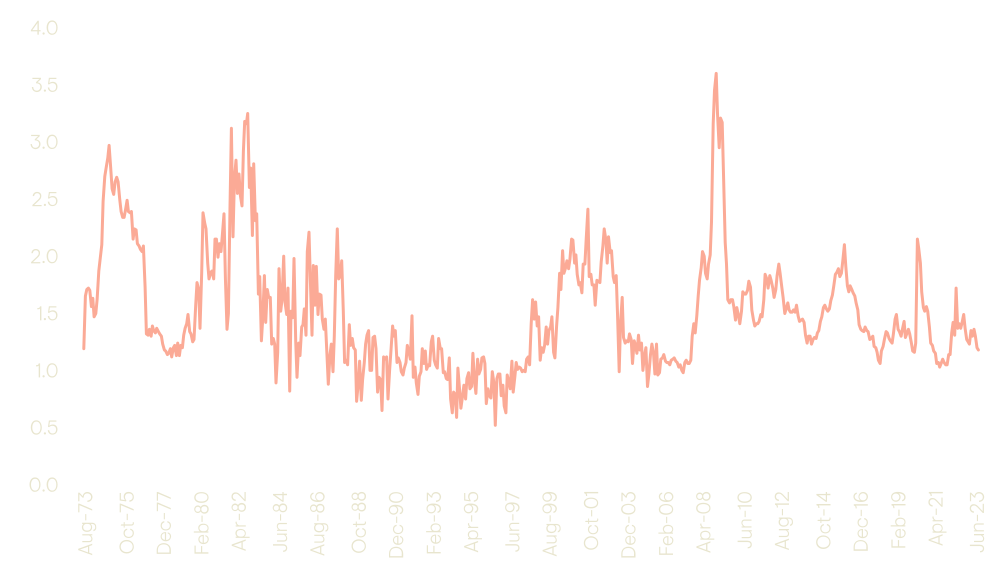
Using proxy data3, we see that the option adjust spread has averaged about 1.5% over the last fifty years.
Figure 6: Option adjusted spread comparison: US Investment Grade versus US Treasury indices
Source: Ninety One calculations; Bloomberg Index data.
Making some simplifying assumptions, we can estimate the (geometric) returns for US fixed income for the last five decades4:
| US Fixed Income | Income | Growth | Valuation |
|---|---|---|---|
| Treasury | 6.3% | 0.0% | 0.3% |
| Investment Grade | 7.0% | -0.9%5 | 0.3% |
Source: Ninety One calculations; Bloomberg Index data.
For both government and corporate debt, the return here is overwhelmingly determined by the Income component.
Extending this analysis to a broader array of local markets, we see a similar message. (Due to data limitations in the Bloomberg indices, we use a shorter period, covering the last 23 years):
| Government debt | Income | Revaluation | Total return (geometric, LC) |
Income – proportion of total |
|---|---|---|---|---|
| US | 3.2% | 0.0% | 3.2% | 100% |
| EU | 3.5% | -0.3% | 3.2% | 110% |
| UK | 4.0% | -0.8% | 3.2% | 124%6 |
| Japan | 1.3% | 0.0% | 1.3% | 100% |
Source: Ninety One calculations; Bloomberg Index data.
In each case, the message remains clear – income dominates returns.
Our equity return decomposition uses a similar approach – Income (being dividend yield), Growth (related to nominal GDP growth, adjusted for market composition changes like new issuance, buybacks and the like) and Valuation (change in multiples). Once more, we are impacted by data shortcomings – in particular, index-level fundamental statistics are not available prior to December 1995 – and then limited to the US markets.
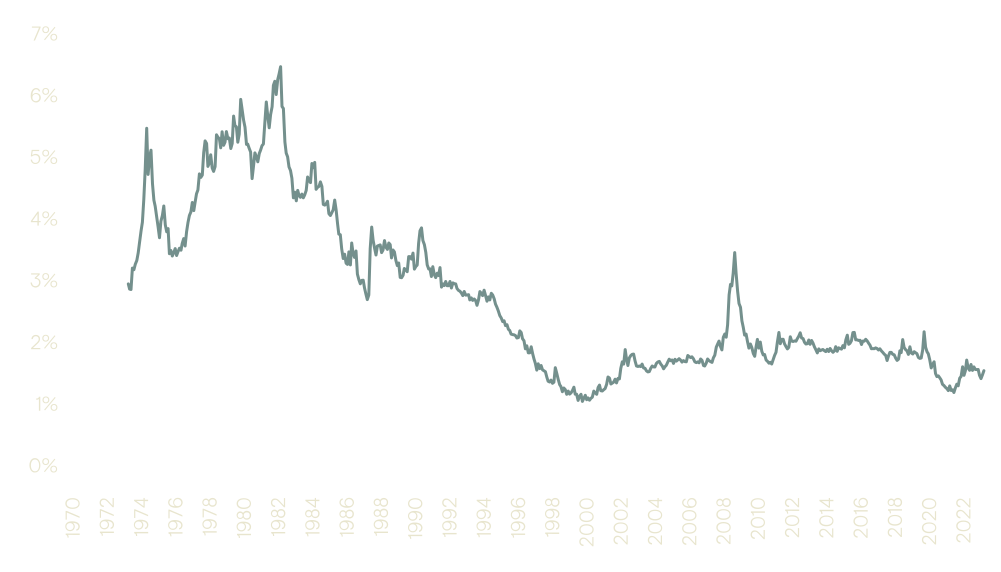
Decomposing the returns over the last five decades suggests that average dividend yield was of the order of 2.9% p.a.:
Figure 7: US dividend yield history
Source: Bloomberg, MSCI.
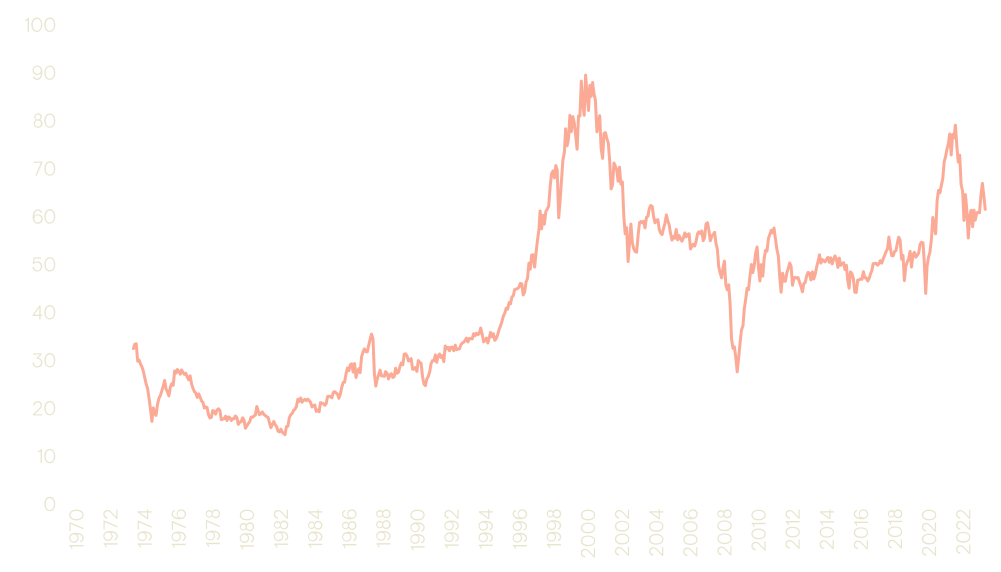
The price-dividend multiple began the period at slightly over 33 (i.e. investors were prepared to pay US$33 for each US$1 of dividends), and is about 65 today – suggesting a consistent rerating upwards. That contribution, of around 1.3% p.a. is anomalous compared to other markets (UK, Japan and Europe were largely flat) and translates into a cumulative doubling over time!
Figure 8: US price-to-dividend multiple
Source: Ninety One calculations; MSCI Index data from Bloomberg.
Nonetheless, Growth was the star of the show – dividends per share revenue grew at a healthy 6% p.a. over the period, resulting in the following outcome7:
| US equities | Income | Growth | Valuation |
|---|---|---|---|
| Annual return contribution | 2.9% | 6.2% | 1.2% |
This pattern is repeated in other regions where, in each case, Growth constitutes roughly 60%+ of the overall return:
| Annual return contribution | Income | Growth | Valuation |
|---|---|---|---|
| Europe ex UK | 3.3% | 5.5% | 0.2% |
| UK | 4.2% | 6.1% | 0.0% |
| Japan | 1.6% | 4.2% | -0.2% |
Source: Ninety One calculations; MSCI Index data from Bloomberg.
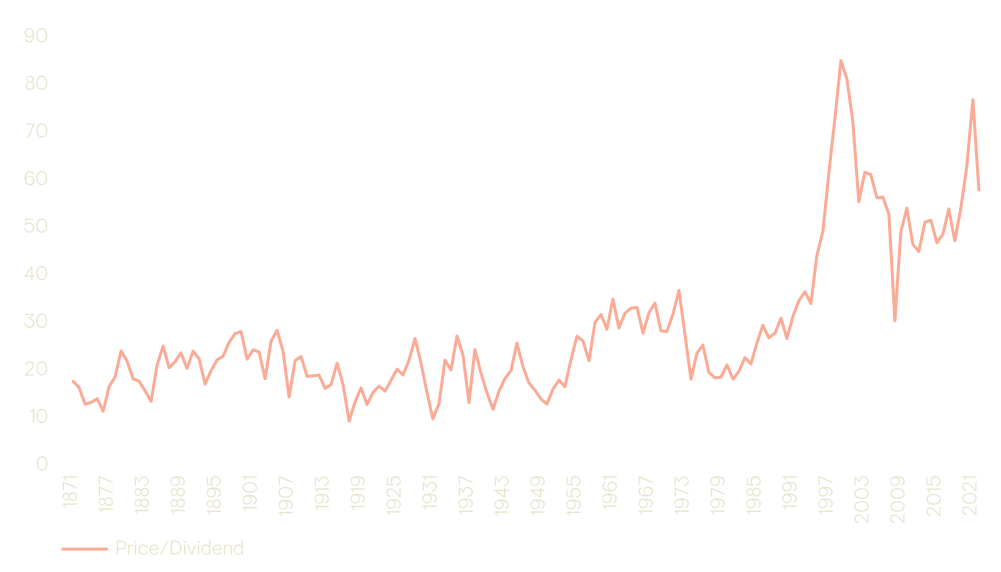
What is evident is how unusual the US valuation experience appears – with other regions flat over the period. Given the very long history available via Shiller for the US, we can place that in context of broader history – from 1871 to end September. Surprisingly, about 85% of the revaluation return was generated in the relatively short period since 1980. As evident from the long-term graph below, excluding this final period, revaluation would have been minor. This aligns with the notion that, in general, we expect valuation drivers to be episodic, but the market tends to be fairly priced over the long term. Given the unusually large recent impact of valuation, this suggests that the relative impacts of growth and income have been understated in the last five decades.
Figure 9: Revaluation impacts (price:dividend ratio)
Source: Ninety One calculations based on Shiller data.
The above suggests that income dominates bond returns, while growth is the primary driver for equity returns. What it does not do is put the current forecasts into historical perspective. We turn to that now, trying to look at as broad a set of markets as possible. We source long-term data8 for both government bond and equity returns, spanning the period from 1900 – 2020, covering 169 countries. If we consider the non-overlapping decades, we have 185 relevant local currency, total return observations. The excess return of equities over bonds averaged about 3.5% p.a., with a lower quartile of -0.3% and an upper quartile of 6.4%.
By contrast, our current expectations for US equities vs bonds are close to identical, with global assets suggesting an outperformance of c. 0.7% p.a. for the next decade – before we consider the relative risk characteristics of bonds versus equities. History therefore suggests that government bonds are relatively attractive compared to equities with a ten-year horizon.
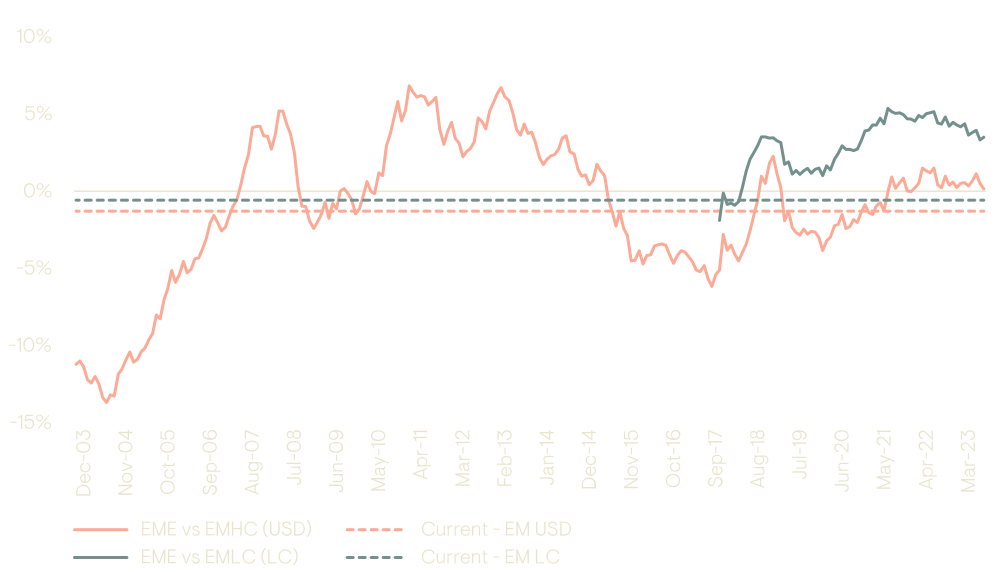
This phenomenon is not limited to developed markets – on the emerging market side, equity returns look unexciting compared to bonds both in hard - and local currency terms. The chart below shows the realised rolling 10-year relative equity outperformance (solid line) versus our expectation for the next 10-years (dotted line). The green line is for hard currency debt versus equities in US dollars, the coral line the same in local currency. The former suggests that the expected underperformance which we are forecasting would not be unusual in this historic context although it would be very underwhelming when compared to periods when EM assets have generated their best periods of performance, notably the 2000s and early 2010s. The latter illustrates how currency complicates the picture – emerging market equity has had a far more consistent track record of outperformance in local currency but suffered in the mid-90s due to currency crises.10
Figure 10: Rolling 10-year return differentials on EM assets
Source: Ninety One calculations; JP Morgan and MSCI Index data from Bloomberg.
EME = Emerging Market Equities; EMLC = Emerging Market Local Currency; EMHC = Emerging Market Hard Currency.
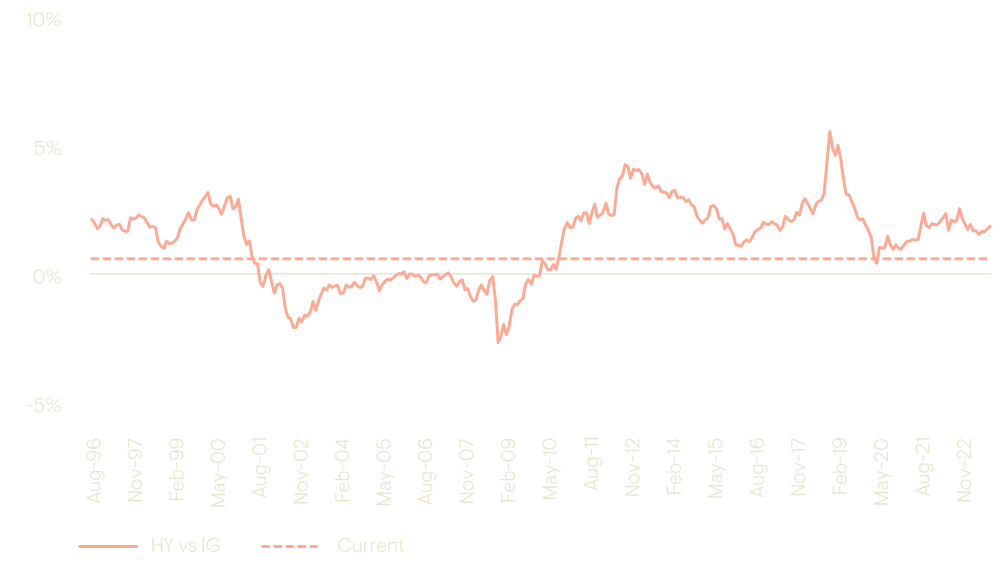
Lastly, we repeat this exercise within the credit space, comparing US high yield to investment grade as an alternative indication of how various elements of credit risk (high yield has more credit risk exposure than investment grade) are being remunerated. The chart below shows the historic relative returns of high yield vs investment grade (solid line), versus our current estimate (dotted line). It once again suggests that the greater ‘risk’ of high yield versus investment grade is not being as well remunerated as it has been in the past.
Figure 11: Rolling 10-year return differentials on US credit
Source: Ninety One calculations; Bank of America data from Bloomberg.
A broad perspective both in terms of history, countries, and asset classes suggests that:
2 On this basis, any change in duration likely falls into ‘Price’ return (‘Valuation’), rather than ‘Growth’; however, it is generally small.
3 Unfortunately, detailed data is not available for the entire period – for example, option-adjusted spread data (i.e. the credit pick-up one receives from bearing counterparty risk) begins in mid-1989. The difference between the Moody’s Corporate Yield and the long-term aggregate US bond yields tracked the OAS for the common period.
4 While we have both price (‘Valuation’) and coupon (‘Income’) contributors to returns from the Bloomberg indices, we need to infer the credit losses. We do so by noticing that the overall change in yields (a c. 2% decrease in each case) was very similar, although their average durations were different (c. five years for Treasuries, vs c. seven years for Investment Grade). That suggests a ‘no-default’ proxy for the Valuation returns on the corporate bond index. On the income side, we estimate credit drag by looking at the government coupon, plus the average corporate spread, and comparing it to the actual income received.
5 An upward sloping yield curve generally contributes a small uplift from duration targeting, as one sells the relatively lower yielding, shorter-tenor, securities to buy high yielding, longer-tenor securities. This likely means that our ‘Growth’ element is overly negative and our ‘Valuation’ element is overly positive, but the impact is probably small in each case.
6 This is a technical side-effect, apparently the result of the timing of a material tenor extension of UK debt.
7 Geometric returns
8 This data, updated to 2020, is based on the original work of Òscar Jordà, Katharina Knoll, Dmitry Kuvshinov, Moritz Schularick, and Alan M. Taylor. 2019. “The Rate of Return on Everything, 1870–2015.” Quarterly Journal of Economics, 134(3), 1225-1298.
9 Australia, Belgium, Switzerland, Germany, Denmark, Spain, Finland, France, UK, Italy, Japan, Netherlands, Norway, Portugal, Sweden, USA.
10 The Emerging Market Local Currency index unfortunately only extends back to 2007, so this cannot be seen in the chart.
Return expectations remain modest, with the US and Europe least attractive and the greatest return opportunities found in emerging markets.
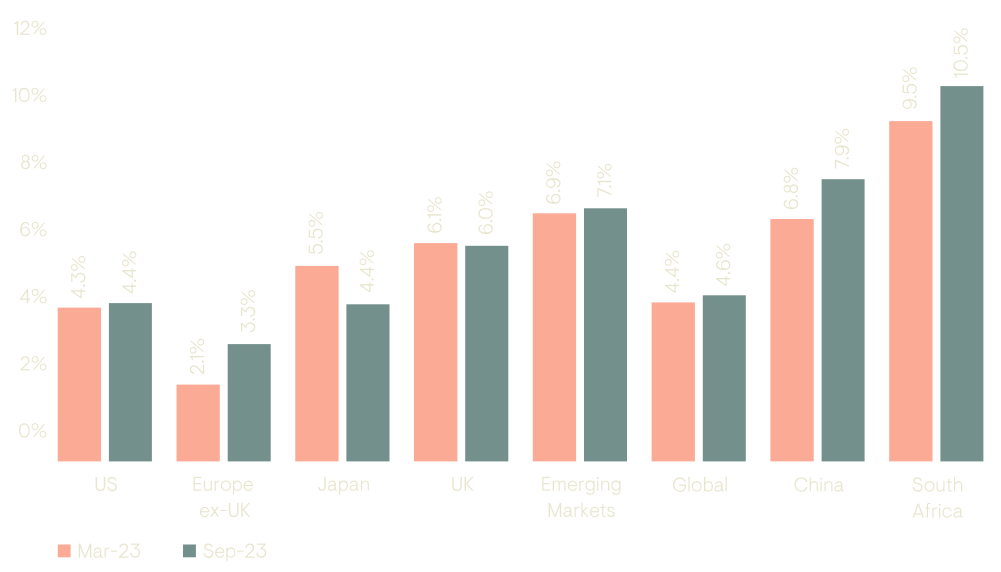
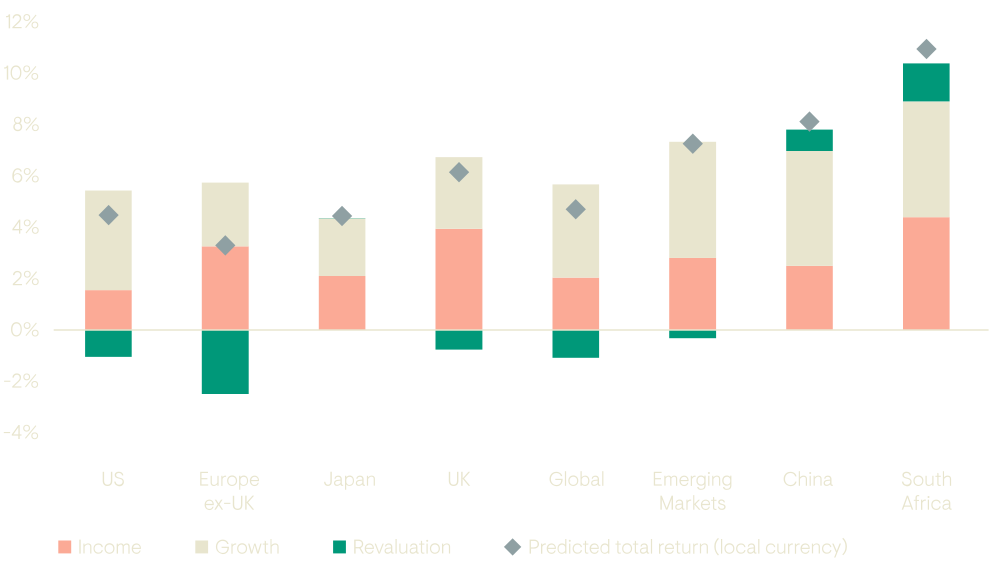
Prospective global equity returns are little changed over the last six months in local currency terms but diverging regional performance results in ongoing regional dispersion. Within developed markets, the UK offers higher expected returns than other developed regions, while emerging markets offer a significant return uplift compared to developed markets.
Figure 12: Equity: 10 year local currency return forecast
Performance does not guarantee future results. Actual returns could be materially higher or lower than projected.
Source: Ninety One (internal calculations based on Bloomberg data).
Prospective returns have increased in Europe ex-UK, China and South Africa, markets which have notably underperformed over the last six months. In each case, the increase in expected returns is largely the result of cheaper valuations. For China and South Africa, significant positive returns are expected from revaluation while in the case of Europe ex-UK, mean reversion of valuations is still expected to weigh on future returns but less so than previously.
More positive revaluation returns in China and South Africa explain almost all of the modest uplift in expected returns for global emerging markets with valuations across the rest of the index little changed in aggregate.
In our last update, we highlighted Japan as the cheapest regional equity market at that point in time. Since then, Japanese equities have outperformed significantly, returning to fair value on our methodology. This has seen prospective returns fall to the point that they are now in line with the US and with the global equity market. The remaining area of value in Japan is the currency which has fallen further in value as Japan has maintained very loose monetary policy even as other economies have continued to tighten their policy stances over the period. This policy divergence appears to be at or near a peak as the Bank of Japan has been preparing the ground for a gradual exit from this extended period of exceptional monetary accommodation while policy makers in major developed economies have signaled an end to interest rate hiking cycles and some emerging economies have started to ease policy. Policy convergence would likely be a significantly positive development for the Japanese yen but this scenario would also present a headwind for Japanese equities on a cyclical horizon.
Figure 13: Growth dominates return expectations, with revaluation almost uniformly negative
Performance does not guarantee future results. Actual returns could be materially higher or lower than projected.
Source: Ninety One (internal calculations based on Bloomberg data). Estimates are nominal, gross of fees and ignore alpha. The final total returns are converted from logarithmic to geometric estimates. This means that the components of the return breakdown may not sum to the total return. Judgmental overrides may apply where deemed necessary – for example as currently applied to the UK assumption to account for the region’s current dividend yield which is in our view structurally out-of-kilter both with its own history, and that of peers. Modelling involves risks, assumptions and uncertainties. These estimates reflect the view of Ninety One’s Multi-Asset team, while the views of other teams across Ninety One may differ.
For information on our Capital Markets Assumptions methodology, please see Important information. Return breakdowns in local currency.
After an extended period where large cap US equities have outperformed most other equity markets - often with lower realised risk – investors are questioning the value of diversification across equity markets. Can Emerging Market equities still offer diversification benefits?
After an extended period where large cap US equities have outperformed just about every other major equity market in the world - often with lower realised risk – it is understandable that investors are questioning the value of diversification across equity markets. We argue that intelligent international diversification should remain a key tool in any broad equity portfolio; that higher correlations in crisis periods do not undermine the case for diversification; and that current valuations matter for both future returns and risk.
To make our case, we will confront the most challenging part of this debate head on – emerging markets – which, over the last decade, have delivered an unwelcome combination of lower overall returns and larger drawdowns in crisis periods.
The argument for diversification in investment portfolios boils down to the truism that the future is uncertain. Faced with an unknowable future, the common-sense response is to hold a spread of investments with distinct return drivers to maximise the chances of meeting long-run return objectives across the broadest range of possible scenarios. Over concentration of risk in investments with fat downside tail risks - such as equities - is particularly unwise given the additional difficulty of recovering from large drawdowns. Therefore, international diversification in an equity portfolio protects against the adverse effects of holding concentrated exposure to a country where long-term economic and corporate performance fails to live up to expectations.
While few take issue with this foundational concept of investment theory, we face a key objection in the context of international equity investments. The global financial system has become increasingly inter-connected in recent decades and one consequence is that in major market crises, correlations between different equity markets tend to increase dramatically. At the very moment that diversification is most valuable, it will always let us down.
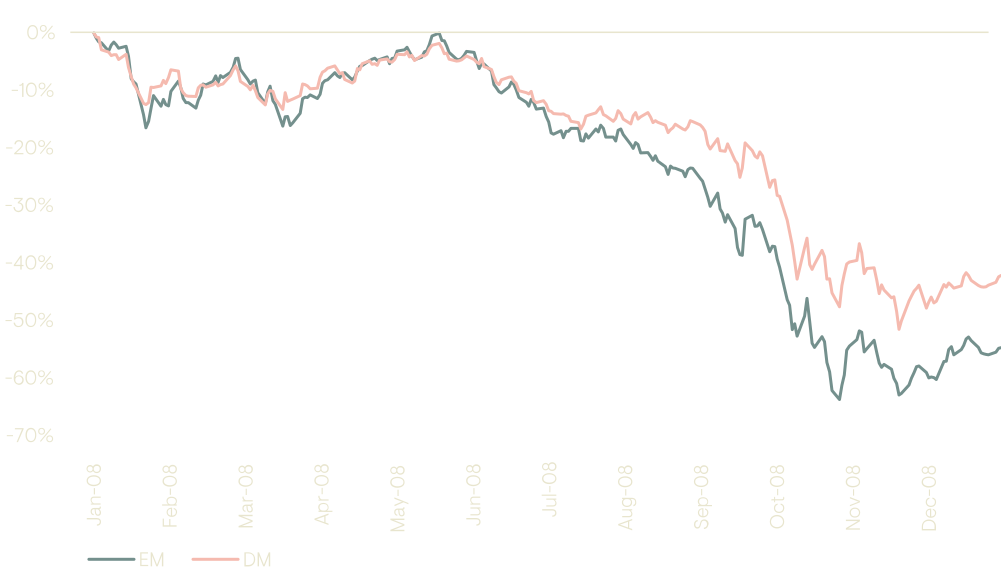
The archetype of this type of market event is the Global Financial Crisis (GFC) of 2008. The epicentre of this crisis was the US real estate market and yet emerging market equities took even more pain than US or other developed market equities.
Figure 14: Emerging vs developed market equity performance in 2008
Source: Ninety One calculations; MSCI data from Bloomberg.
We agree that it is crucial to understand this crisis dynamic when investing in emerging markets, which are more reliant on international capital flows and are therefore subject to the risk that capital is pulled out of the market for reasons which have very little to do with domestic fundamentals. An overly narrow focus on this feature of emerging markets investing ignores the diversifying and risk-reducing benefits that emerging market equities offer under almost all other market conditions.
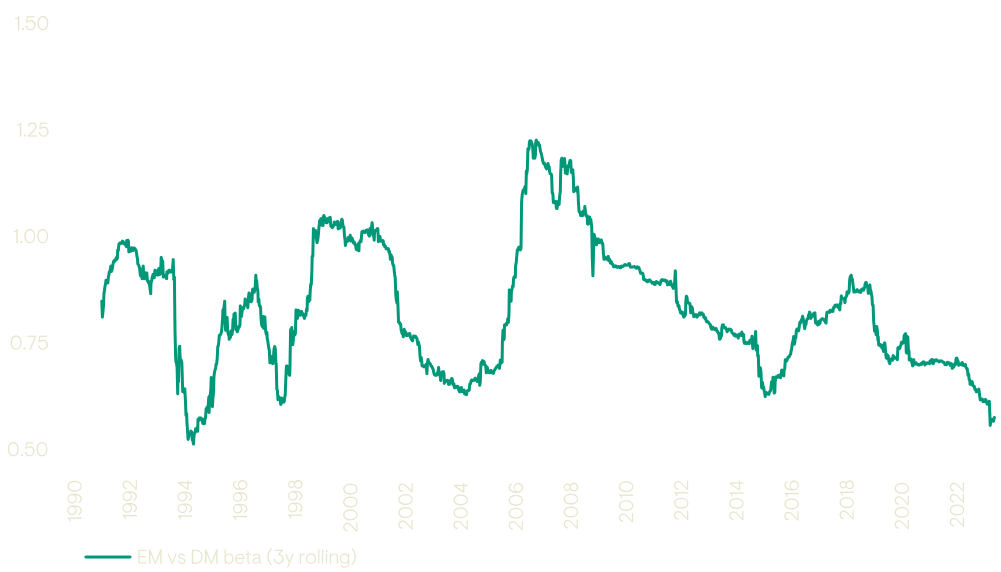
One way to demonstrate this is in terms of the beta or sensitivity of emerging market equity returns to developed market equity returns. On a rolling three year time horizon for example, this beta has been below one for virtually the entire history of the MSCI Emerging Markets index. It is only for the period which includes the GFC that the beta was clearly above one.
Figure 15: Emerging vs developed market rolling three-year beta
Source: Ninety One calculations; MSCI data from Bloomberg.
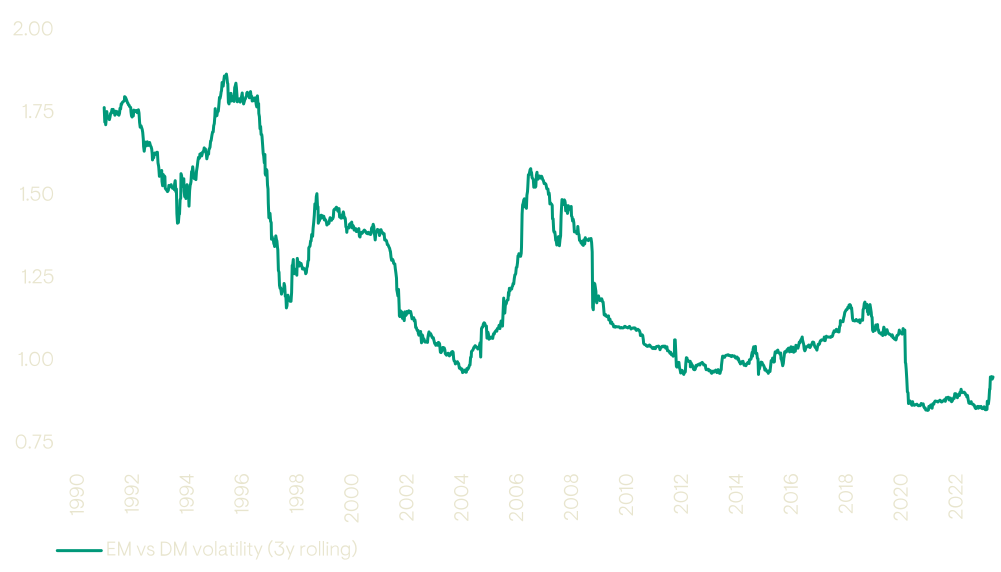
In addition, the standalone risk characteristics of emerging market equities have changed dramatically since the early years of the asset class. As emerging economies and financial markets have matured, volatility has been steadily declining to the point that in recent years emerging market equity volatility has consistently been lower than developed markets.11
Figure 16: Emerging vs developed market rolling three-year volatility
Source: Ninety One calculations; MSCI data from Bloomberg.
If we consider the correlations across regional equity markets over the full period since 1987, we see that emerging markets have on average offered significant diversification benefits with correlations of 50-60% with other regions compared to correlations of 70-80% across US and European indices (Japan has also been a strong diversifier with correlation characteristics in line with emerging markets).
EM diversification benefits
| US | EU | UK | JP | EM | |
|---|---|---|---|---|---|
| US | 100% | 75% | 71% | 48% | 58% |
| EU | 100% | 84% | 55% | 65% | |
| UK | 100% | 50% | 58% | ||
| JP | 100% | 53% | |||
| EM | 100% |
Source: Ninety One calculations; MSCI data from Bloomberg.
In most conditions, emerging market equities are not unduly risky relative to other equity investments, but additional vigilance is required around their fragility in major crises. In statistical terminology, we say that a relatively low standard deviation of returns does not fully describe the risk characteristics of emerging market equities as they are also more negatively skewed and fatter tailed than developed market equities. The response to this challenge we believe is not to avoid emerging market equities but to invest with a strong risk management framework and a keen awareness of the macro drivers of emerging markets.
The final component of a historical analysis of international diversification in equity markets is to consider the role of relative returns. There is no doubt that from a US perspective, international diversification has been a drag on returns for essentially the whole period since the GFC. During this period, emerging market growth has been particularly disappointing, although as explored in this case study, the driver of this has been market composition impacts as underlying corporate revenue and profit growth continued at relatively high rates. An equally important driver of US outperformance has been valuation changes with US equity valuations moving ever higher while valuations across other developed and emerging markets derated. A core principle of our Capital Markets Assumptions approach is that starting valuations are a major driver of long-term returns. Our latest forecasts suggest that current valuations are a significant headwind for US equity returns in particular, and as a result we expect the return impact of international diversification over the next ten years to look very different to the experience of the last decade.
Return contributions 10 years to 30 September 2023
| US | EAFE12 | EM | ||
|---|---|---|---|---|
| Logarithmic return (local currency) |
Income | 1.9% | 3.1% | 2.8% |
| Growth | 6.4% | 4.1% | 3.0% | |
| Revaluation | 2.8% | -0.2% | -0.6% | |
| FX vs USD | 0.0% | -2.8% | -2.8% | |
| Geometric total return (USD) | 11.8% | 4.3% | 2.5% | |
Source: Ninety One; MSCI data from Bloomberg.
11 This chart is calculated using local currency return across both markets. Measuring returns in a common currency such as the US dollar makes
some differences to the levels of these series but all of the specific points made in the text hold in both local currency and US dollar terms.
12 Europe, Australia and the Far East.
The currency decision – particularly whether to use ‘hedging’ or ‘conversion’ – can have a material impact on the outcome.
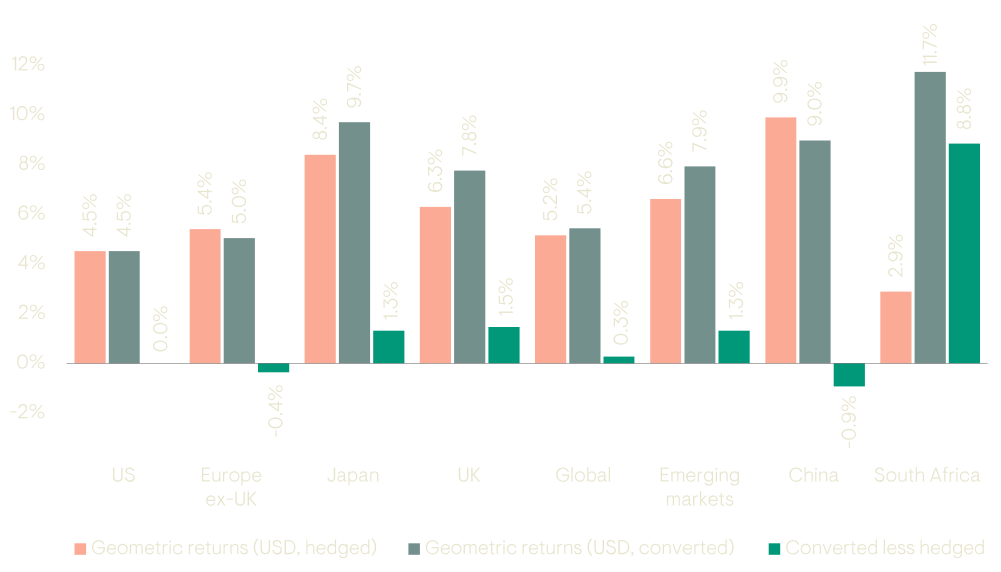
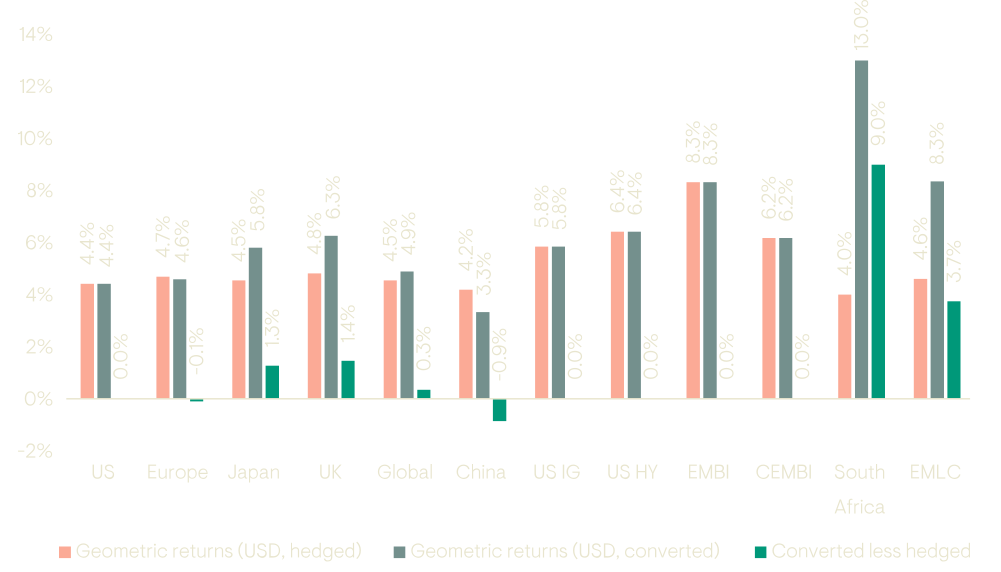
While we calculate our expected returns on a ̒local currency’ basis, we appreciate that clients need to make a currency decision – whether to hedge or not. We therefore show each of our equity and fixed income assumptions on these two bases – hedged (using interest rate parity) and unhedged/converted (based on real exchange rate reversion).
Figure 17: Equity expectations
Source: Ninety One (internal calculations based on Bloomberg data).
Figure 18: Fixed income expectations
Source: Ninety One (internal calculations based on Bloomberg data).
EMBI = Emerging Markets Bond Index; CEMBI = Corporate Emerging Markets Bond Index; EMLC = Emerging Market Local Currency
We focus on fundamentals. We divide returns into three components. The first is known and widely available, but the other two are subject to material misestimation.
Predicting long-term returns is fraught with difficulty; market values are not only determined by fundamentals, but also sentiment and exogenous events. We aim to keep things as straightforward as possible, and therefore focus on fundamentals. We:
|
Favour simplicity to capture the key drivers and accept wide uncertainty bands |
Strive for consistency with the investment process, focusing on cashflows |
Aim to be comprehensive across asset classes, with the ability to extend within |
We divide returns into three components. The first is known, more readily measured and widely available in the public domain, but the other two are subject to material misestimation:
|
Income – yield is the single most important explanatory factor for income-generating assets |
Growth – the extent to which income will likely change over time |
Revaluation – the price per unit of income likely to apply at the end of the period |
By default, we assume a 10-year investment horizon, to reflect the fact that we are long-term stewards of client capital. We do not consider tax, given different requirements pertaining to different mandates. The approach we outline is our baseline estimate; we may make judgmental adjustments to the underlying drivers if warranted.
Our approach mimics that of a systematic investor, buying the entire market.
Here we set out our methodology for equities, fixed income and currencies:
|
Equities |
Sovereign debt and credit |
|---|---|---|
Income |
Current dividend yield |
Current yield on notional bond15 |
Growth |
Nominal GDP per capita13 growth plus Market composition impacts (IPOs, M&A, index inclusion events etc)14 (Each based on a 15-year historic trend) |
Anticipated change in yield based on market-inferred future risk-free yields16 plus Roll-yield on the risk-free curve17 less Credit losses based on a 15-year historic average18 |
Revaluation |
Reversion to a cyclically adjusted price-to-dividend ratio (based on 15-year trend dividends per share) |
Reversion to the market-inferred future risk-free yields plus Reversion of credit spread to 15-year average |
| Currency | ‘Hedging’ – based on current interest rate differentials on 10-year zero-coupon bonds or ‘Conversion’ – based on a reversion of the real exchange rate to the 15-year average, with an allowance for differences in inflation targets |
|
13 Where a market has a high proportion of overseas sales, we use the average of the local and global nominal GDP per capita trend growth rates.
14 Uses the average of local and global issuance trends given lower predictability for more specific universes and a belief in global convergence. Overrides may also be applied where local figures are volatile.
15 Yield to Maturity based on notional 10-year bonds (except in the case of High Yield and EM Corporate, where 5-year bonds are used). For EM Hard Currency, US High Yield and EM Corporate, we use the underlying risk-free curve plus spread-to-worst to construct the initial yield.
16 Credit spread curve data tends to be unreliable; we presume because the notion of quality changes with tenor. We therefore assume a constant spread.
17 This is an implicit allowance for rebalancing of the constant maturity bond.
18 Based on Moody’s default data.
Equities are assumed to be purchased on a buy-and-hold basis. We use relevant MSCI indices to reflect the regions.
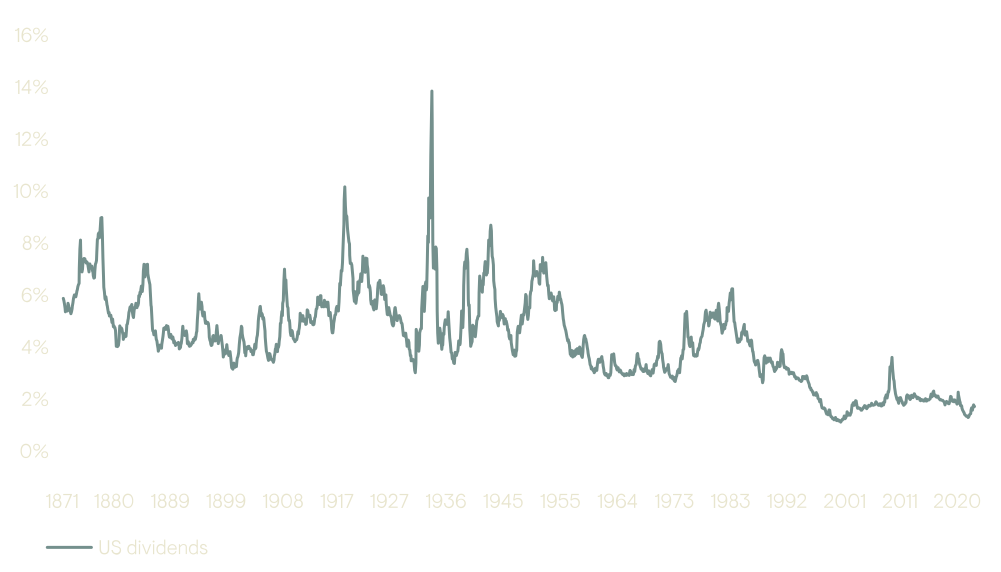
We proxy income with dividends. While many equity investors prefer to focus on earnings, we regard dividends as being less subject to manipulation – these distributions are a tangible payment, and the information is publicly disclosed – and therefore more reflective of the long-term fundamental cash-generating properties of the broad market. While other metrics (e.g. free cash flow) have evolved, they do not yet have similarly long history.
Figure 19: The history of US dividends stretches back over a century
Source: Shiller, U.S. Stock Markets 1871-Present and CAPE Ratio.
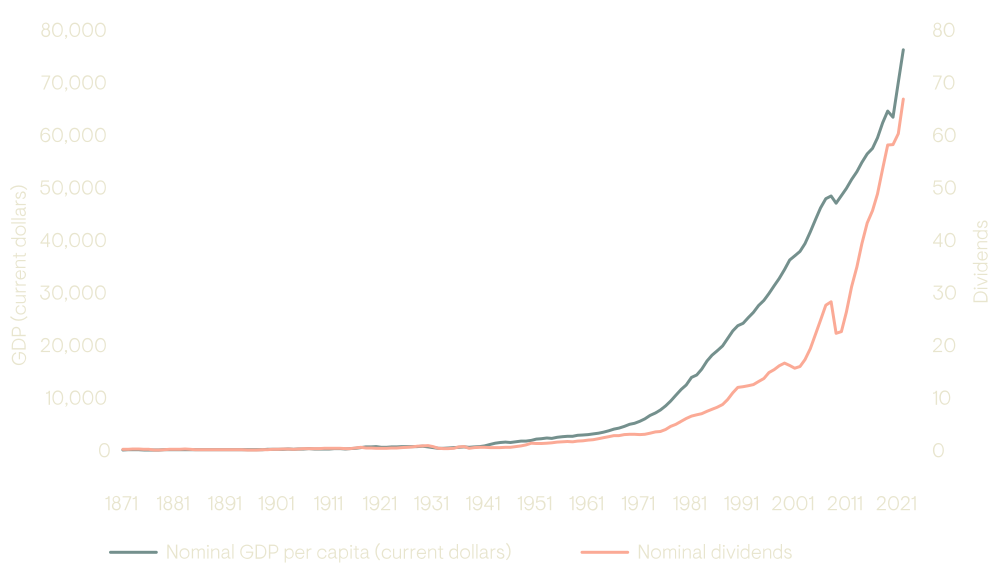
In this context, growth primarily relates to an equity market’s ability to increase dividends over time. GDP per capita has historically proven to be a reasonable proxy for dividend growth – and a closer match than GDP itself, as illustrated in the next chart. We simply allow for the global effects of growth based on the extent of non-domestic revenue exposure, assuming developed market growth is an average of local and global growth, while emerging market growth is wholly determined locally19. Growth is proxied based on trailing 15-year trend growth, a period that captures the secular effects of a couple of cycles. We apply a market adjustment factor – which includes changes in market composition relating to primary and secondary issuance, M&A activity, buybacks, new index inclusions etc. In each case, an owner of the market would have to either inject or remove capital to remain fully invested.
Figure 20: Nominal GDP per capita has proved a useful proxy for dividend growth
Source: Shiller, U.S. Stock Markets 1871-Present and CAPE Ratio; Samuel H. Williamson, “What was the US GDP Then?” MeasuringWorth, 2022.
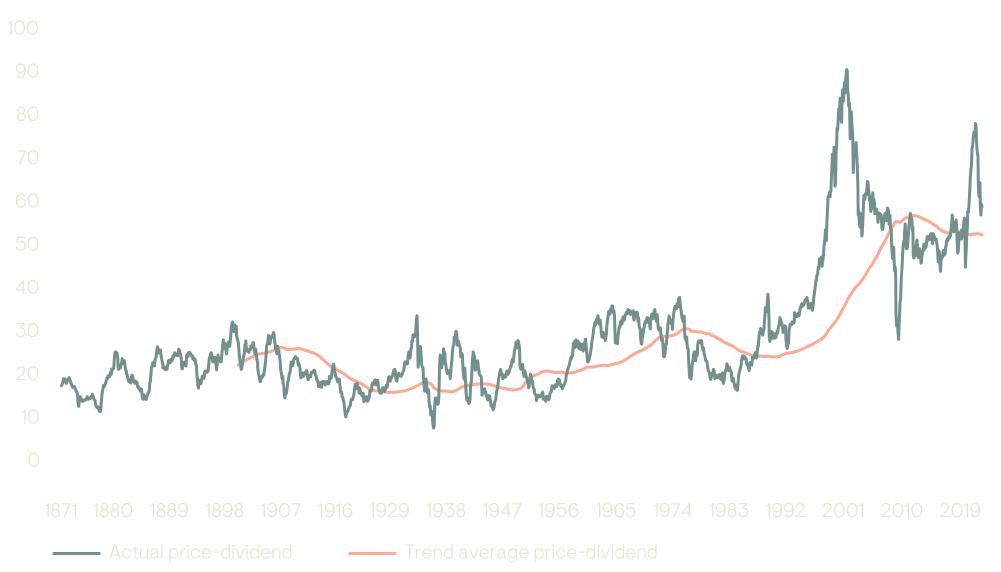
Lastly, we factor in an adjustment for revaluation. We believe that valuation acts as a gravitational pull over long periods; however, changes in market composition and dynamic means that this is not a static metric. We use the price-dividend ratio and trend dividend yield as our valuation metric, assuming this reverts to a long-term (15-year) average. This allows us to both maintain consistency with our income-focused framework, and smooth out the cyclical nature of dividends. While we acknowledge full reversion is unlikely – prices tend to overshoot both on the upside and the downside – this simplification remains conceptually sound on average, as can be seen in Figure 21.
Figure 21: The actual price-dividend reverts reasonably neatly to the trend average over time
Source: Shiller, U.S. Stock Markets 1871-Present and CAPE Ratio, internal calculations.
Our portfolios target specific duration contributions when allocating to bonds; therefore, we feel it appropriate to use constant maturity bonds as the basic building block. We further deconstruct bonds into risk-free and spread components, enabling us to cover both sovereign and corporate debt.
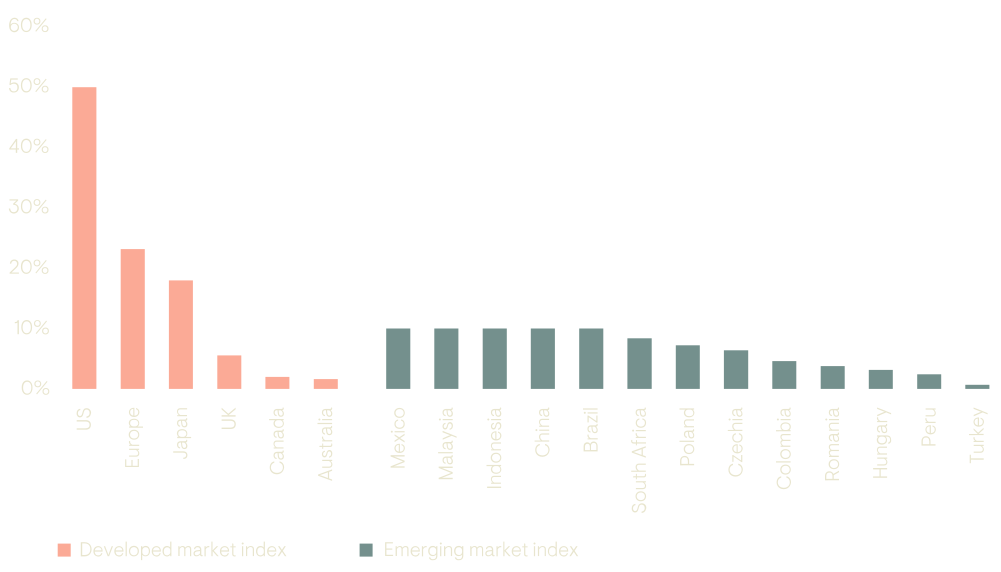
Income assumes the par yield of the bonds, typically for a notional 10-year bond. Regional indices are then generated by using the weighted average of the relevant market inclusions, as illustrated below.
Figure 22: Regional indices are generated using a weighted average of the relevant countries
Source: Ninety One calculations. Weights based on JP Morgan indices.
We define growth as being the roll yield obtained from consistently rebalancing the portfolio to maintain a constant maturity. So, for example, with a typical contango yield curve where the longer-term price is higher than the short-term, after one year the bond holder would sell the lower yielding, higher priced nine-year bond to buy a higher yielding, lower priced 10-year bond. Implicit in this view is a belief that the shape of the yield curve remains relatively consistent (including a constant spread component for credits).
Figure 23: Growth is the roll yield from consistently rebalancing the portfolio to maintain a constant maturity
Source: Ninety One. This graphic is for illustrative purposes only.
Revaluation is easier for government bonds than corporates; the former typically have liquid, traded markets enabling us to infer the forward market expectation of pricing. The implicit belief that markets converge to these expectations seems reasonable as a baseline for active management decisions. Credit spreads are, however, less broadly available; we therefore assume that the excess spread reverts to its 15-year average.
We calculate currency returns in local currency. As explained in the currency section, we then adjust on two bases:
Since it is common practice to hedge currency risk, and these costs are largely known at the date of investment, we use this as our base case. We assume that the position is hedged at inception for the 10-year horizon (essentially ignoring the small cash-flow differences that might occur), using covered interest rate parity. We derive the relative hedging cost from the zero-coupon bond yields corresponding to the investment horizon.
Many investors are willing to bear the currency risks, and therefore hold their assets unhedged. To proxy this, we use real effective exchange rates – i.e. adjusting the currency cross rates for relative inflation movements. We assume these exchange rates revert to their 15-year averages with an allowance for the difference in inflation targets, thereby allowing some currency mean reversion.
19 Based on the Morgan Stanley Global Exposure Guide 2022, Developed Markets tend to average c. 40% foreign exposure, while Emerging Markets are roughly 25%.
To foster a sense of dialogue, we include a curated list of questions we have received from various stakeholders and our responses. We will continue adding to this section over time.
GDP per capita has historically proven to be a reasonable proxy for dividend growth.
This is even though the relationship between fundamental company growth, in aggregate, and country-level economic growth is weaker than might otherwise be expected due to compositional mismatches. For example, GDP includes both private and public sector outputs; however, only the former are captured in aggregate via listed equities. Similarly, economic growth tends to be locally focused whereas listed companies often have substantial global operations.
We make allowances for credit defaults with the bond growth rate, using Moody’s long-term default histories. We use the Moody’s country rating for specific country sovereign debt, and the ratings banding for credit indices. By assuming that am AAA rating has similar meaning in both sovereign and corporate contexts, we can reasonably proxy a wide array of indices. (Based on history, we have applied an additional default factor for sub investment grade sovereign debt).
Inflation is notoriously difficult to predict; so much so, that our work suggested that nominal forecasts were often more reliable than real forecasts.
Both are common approaches to international exposure – some prefer hedging, whereas others are prepared to bear the resultant currency risk. We therefore thought it appropriate to include both so, irrespective of preference, the assumptions would be useful.
Capital Market Assumptions are a framework for thinking about reasonable client outcomes and providing broad market context. These figures do not directly result in individual investment decisions.
Importantly, the Capital Market Assumptions represent the view of the Multi-Asset Capability within Ninety One; other investment teams are free to disagree.
We wish the framework to be consistent over time to help sharpen thinking on asset-level drivers; therefore, where possible, we prefer to use set assumptions.
We do, however, reserve the right to override specific assumptions where there is a strong market-specific reason to do so.
We wish to understand potential client outcomes over the long-term; therefore, our focus is on identifying those drivers which best explain and predict such outcomes. As can be seen in our framework, that can be done without specific macro-economic views.
For corporate cashflows to continue growing at a significantly faster rate than the broad economy, one of three things needs to occur:
In short – because we focus on variables that have both been historically predictive and have a sensible fundamental interpretation, we continue to favour GDP as a predictor (implicitly, of revenue). We continue to actively research appropriate variables for margins and pay-out ratios; however, in an environment where we think each faces headwinds, we are comfortable to continue with our simplifying assumption.
We intend to update the Capital Market Assumptions twice each year – after the March and September quarter-ends.
We may also provide intra-period updates if we believe a market event is significant enough to materially change the 10-year outlook. For example, we released an internal update in late March 2020 to highlight the potential upside from equities and credit after the initial COVID-induced market collapse.
The index divisor is defined as:
Index divisor = Index market cap/Index price
The index divisor is central to the calculation of equity indices because there are corporate actions and compositional changes which affect the aggregate value or market capitalisation measured by the index, but which do not impact the performance of the index. When the market value of the index increases or decreases because of one of these events, the index divisor is adjusted to ensure that the price of the index remains unchanged.
The impact of specific corporate actions or compositional changes can be either positive or negative for future returns, but they are aggregated into a single overall value.
A non-exhaustive list of some of the corporate actions which impact the index divisor is given in the table below.
| Corporate action | Impact on index divisor | Impact on index returns |
|---|---|---|
| Share repurchase (buyback) | Negative | Positive |
| Rights issue | Positive | Negative |
| Stock-based compensation | Positive | Negative |
| IPO | Positive | Negative |
| Cash acquisition (of index constituent) | Negative | Positive |
| Spin-off (where spin co is not an index constituent) | Negative | Positive |
In addition, the composition of the index can change as a result of index rebalancing events where index rules determine that existing companies be added to or removed from an index or that the proportion of a company’s shares which are included in the index changes. For regional indices, whole countries may also be added or removed from the index.
Items such as buybacks tend to be stable – their attractiveness is based on the regulatory and taxation basis applicable at a point in time, which tend to change infrequently. Other sources may be more volatile – for example, market changes due to M&A activity, views on the appropriateness of stock-based compensation, or even secondary issuance due to market stress. We infer the market adjustment impact from the change in MSCI Index Divisor over time.
Broad economic growth drives the growth generated by the listed corporate sector over the long run. However, it is accepted that corporate action, including mergers, acquisitions, research, and innovation ensure that the corporate sector is dynamic, undergoing compositional changes over time.
Our process starts with an assessment of the aggregate growth of the dividends paid by this dynamic mix of businesses. The next step is to make a market adjustment to capture all the corporate actions and index composition changes which directly increase or decrease the total value of equity measured by the market index.
As defined, the market adjustment factor is important as it changes the participation in the aggregate dividend growth of the entire market for an ongoing investor in the index. Market adjustments at the index level are analogous to but not identical to the way that equity issuance and repurchases affect returns for a single stock. To understand this, we must first recognise that to receive the index return, an investor must build a portfolio which holds every stock in the index in their index weights and which adjusts these holdings over time as index composition and weights change.
Any corporate action or index composition change which adds new equity capital into the index therefore dilutes future index returns in the same way that a company making a rights issue dilutes returns for holders of that stock. In both cases, if an investor does nothing, their ownership of the index or of the stock declines and the proportion of future value creation which flows to their shares falls. On the flipside, any corporate action or index composition change which removes equity capital from the index is accretive to future returns in the same way that a company repurchasing and retiring existing shares is accretive.
Importantly, these effects only directly impact an investor who seeks to own the entire market as defined by the index provider. For an active investor who does not hold the companies which launch these corporate actions there is no direct impact on their returns although there may be indirect impacts because of related capital flows or changes in the competitive environment.
We see two key benefits:
As can be seen in this analysis, the Capital Market Assumptions have shown clear differences between market troughs and market peaks.
Dividends, being physical payments to shareholders, are less subject to manipulation than earnings (which are only book profits). We believe that results in stronger conclusions.
In addition, data sets tend to have a longer history of dividend payments, enabling us to consider the approach in a broader variety of historic contexts.
Our Capital Market Assumptions assume that the fundamental market drivers remain unchanged. They therefore ignore exogenous shocks – e.g. climate risks and geopolitical events (although we may update our assumptions in the event of a material shock).
We currently focus on single-asset return outcomes; therefore, we make no comment about potential changes in cross-asset correlations or asset-specific volatilities.We do not adjust for individual client circumstances either: client tax status may impact the relative attractiveness of asset classes.
As long-term custodians of our client’s capital, our focus is on helping our clients achieve suitable outcomes.
In addition, we require a timeframe long enough for fundamental drivers to be expressed, despite cyclical noise.
If you have any questions about our framework that you'd like to discuss further, please complete this form and we will respond to you directly
General risks. Forecasts are inherently limited and modelling involves risks, assumptions and uncertainties, they are forward looking and are not guarantees nor a reliable indicator of future results. Actual returns could be materially higher or lower than projected. This information is not intended as a recommendation to invest in any particular asset class or strategy or as a promise of future performance. The value of investments, and any income generated from them, can fall as well as rise. Costs and charges will reduce the current and future value of investments. Where charges are taken from capital, this may constrain future growth. Past performance is not a reliable indicator of future results. If any currency differs from the investor's home currency, returns may increase or decrease as a result of currency fluctuations. Investment objectives and performance targets are subject to change and may not necessarily be achieved, losses may be made. Environmental, social or governance related risk events or factors, if they occur, could cause a negative impact on the value of investments.
Ninety One’s Capital Market Assumptions framework focuses on the key drivers of long-term performance. We do this to better understand possible future returns, enriching discussions with our clients.
Ninety One's multi-asset growth team provides insights into the macroeconomic environment that informs our investment outlook for the coming quarter. This includes concise summaries of our asset class views.
Darpan Harar, Co-Head Developed Markets Specialist Credit, and Jared Cook, Portfolio Specialist, discuss the big theme moving credit markets this year: the surge in bond issuance by tech giants to fund spending on AI. Investors can find better value for similar underlying risk to this ‘hyperscaler issuance’ in other corners of the credit market. Darpan explains where to look and what to look for.
A week in the Corn Belt, including farm visits and meetings with companies across the US agricultural value chain, highlighted that the backdrop in agriculture is changing. We see selective opportunities for long-term investors.
From generic manufacturing to developing innovative medicines, China’s pharmaceutical industry is moving up the value chain, creating new opportunities for equity investors.
A weaker dollar has long been a tailwind for emerging market returns. The US currency may trade sideways for a spell, while Paris and Beijing hold back the euro and Asian currencies, but its structural downcycle is far from over. Meanwhile, emerging market asset classes still offer plenty of opportunity for selective investors.
Clyde Rossouw, Head of Quality, discusses two high-quality medical device companies operating in different areas of healthcare - Align Technology in orthodontics and Edwards Lifesciences in structural heart diseases – and what makes their businesses so durable.
Europe’s record-breaking summer could add further momentum to the energy transition. There are multiple ways investors can access the opportunity.
Our credit experts review how credit markets fared in the third quarter of the year and share the latest scorecards for the global credit universe.
EM debt remains an asset class in which asset allocators favour an active management approach, but the passive versus active debate continues. Here we outline the key considerations – relating to returns, fees and benchmark construction – behind our view that passive approaches are sub-optimal for EM debt investors.
While many people still associate the Motorola name with the flip phones of the 1990s and early 2000s, this nostalgia is a thing of the past. Over time, the business has transformed itself into a provider of critical communication networks for emergency services globally. Paul Jones explains why this makes the company an ideal candidate for the Quality universe.
Our EM Debt team shares its latest outlook and positioning across the investment universe.
Markets diverged in the third quarter, with equities holding firm while bonds sold off as yields rose. A renewed US-Iran escalation lifted Brent crude sharply, reviving inflation concerns and prompting central banks in the US, Eurozone and Japan to raise rates in September. Equities still made modest gains, led by the US and supported by resilient growth and robust earnings, while gold and copper also rose.
A trip to the US over the summer to speak with allocators highlighted strong interest in EM equities. But it also flagged important questions about investing in this dynamic and recently underexplored part of the stock market.
Central banks have returned to the gold market in force since the Q1 slowdown. With the gold price appearing better supported than many market participants had assumed, the case for a re-rating of gold equities is strengthening.
The Value team explains how it hunts for mispricings in moments of rising uncertainty in markets.
Developed-market bond yields have risen together, but for very different reasons. The contrast between the UK and US shows why investors need to look beneath the headline move.
Our EM Debt team shares its latest outlook and positioning across the investment universe.
EM equity gains in 2026 have been narrow, concentrated in AI-driven information technology. Archie Hart and Varun Laijawalla explain why this memory upcycle looks structurally different to previous ones, with recent earnings from the key players supporting a fundamentals story. They believe the theme is early, rather than exhausted.
Growth momentum is building across the Chinese economy, not solely in technology-linked sectors. We see opportunities for investors to align with the country’s ongoing structural transformation.

Market and portfolio insights, webinars & events curated from across our investment teams to help you steer through changing investment landscapes.
Important information
Source: Ninety One proprietary capital market assumptions as at 30 September 2023.
These estimates are gross of fees (returns can be reduced by management fees and other expenses incurred) and reflect the view of Ninety One’s multi-asset team, whilst the views of other teams across Ninety One may differ. Details on our Capital Market Assumptions methodology available upon request.
Our expected returns estimates are for illustrative purposes only, are not a guarantee of performance and are subject to change. They are provided merely as a framework to assist in the implementation of an investor’s own analysis and an investor’s own view on the topic discussed herein. They should not be relied upon as recommendations to buy or sell securities. Forecasts of financial market trends that are based on current market conditions constitute our judgment and are subject to change without notice. We believe the information provided here is reliable, but do not warrant its accuracy or completeness. The outputs of the assumptions are provided for illustration/discussion purposes only and are subject to significant limitations. Expected return estimates are subject to uncertainty and error. Expected returns for each asset class are conditional on an economic scenario; actual returns in the event the scenario comes to pass could be higher or lower, as they have been in the past, so an investor should not expect to achieve returns similar to the outputs shown herein. Because of the inherent limitations of all models, potential investors should not rely exclusively on the model when making a decision. Unlike actual portfolio outcomes, the model outcomes do not reflect actual trading, liquidity constraints, fees, expenses, taxes and other factors that could impact the future returns. Note that these asset class assumptions are passive, and do not consider the impact of active management. All estimates in this document are in US dollar terms unless noted otherwise. The final total returns are converted from logarithmic to geometric estimates. This means that the components of the return breakdown may not sum to the total return. While useful for modelling and calculation purposes, the logarithmic return is theoretical (assumes continuously compounding returns) whereas the geometric estimate reflects practical experience (reflects discrete periods of compounded returns).
Indices
Indices are shown for illustrative purposes only, are unmanaged and do not take into account market conditions or the costs associated with investing. Further, the manager’s strategy may deploy investment techniques and instruments not used to generate Index performance. For this reason, the performance of the manager and the Indices are not directly comparable.
If applicable MSCI data is sourced from MSCI Inc. MSCI makes no express or implied warranties or representations and shall have no liability whatsoever with respect to any MSCI data contained herein. The MSCI data may not be further redistributed or used as a basis for other indices or any securities or financial products. This report is not approved, endorsed, reviewed or produced by MSCI. None of the MSCI data is intended to constitute investment advice or a recommendation to make (or refrain from making) any kind of investment decision and may not be relied on as such.
If applicable FTSE data is sourced from FTSE International Limited (‘FTSE’) © FTSE 2023. Please note a disclaimer applies to FTSE data and can be found here.
Global equities = MSCI All Countries World; Developed equities = MSCI World; US equities = MSCI USA; Continental Europe equities = MSCI Europe ex UK; Japan equities = MSCI Japan; UK equities = MSCI UK; Emerging equities = MSCI EM; China equities = MSCI China; Global sovereign bonds = Country-weighted composites, based on the JP Morgan Global Bond Index, of our regional estimates*; US, Europe, Japan, UK, China sovereign bonds = Notional 10-year bond; Emerging (Local Currency) bonds = Country-weighted composites, based on the JP Morgan GBI-EM Global Diversified, of our regional estimates*; US Investment Grade = Notional 10-year bond, using Bloomberg US IG Yield Curve; US High Yield = Notional 5-year bond, using ICE BAML US High Yield index for OAS; Sovereign Emerging (Hard Currency) = Notional 10-year bond using JP Morgan EMBI Global Diversified Index spread; Emerging Investment Grade = Notional 5-year bond using JP Morgan CEMBI Global Diversified Index spread.
*Not all of which are shown here.