An ongoing debate
Investors face increasing choice across the investment spectrum, with the active versus passive debate extending its reach. In certain asset classes, such as large-cap US equities, passive investing has been the dominant expression of risk, accounting for an estimated 61% of assets under management – up from around a third 10 years ago. In emerging market (EM) debt, however, just one-fifth of assets are managed passively, but the debate continues.1
Proponents of passive approaches typically claim that active managers do not deliver consistent alpha and that passive fees are significantly lower than active. This boils down to the question: can active managers in EM debt add sufficient value to justify the higher fees they charge?
In this paper, we analyse performance outcomes to assess whether active managers have historically generated significant alpha. We then take stock of the alpha capture opportunities available to EM debt investors, before shedding light on some key considerations regarding passive approaches to investing across this asset class.
Ten years of active and passive strategy performance
Have active approaches delivered alpha consistently?
Our analysis focused on the eVestment universe, which surveys 109 managers with combined assets under management of US$460 billion (as at the end of Q2 2026). We assessed three-year rolling excess returns2 in the EM sovereign universe over the last 10 years and found the following:
- On the local currency side (Figure 1), top-quartile active managers have outperformed by up to 242bps (gross of fees), and every quartile – not just the median – has stayed ahead of the index in every three-year window since the start of 2020.
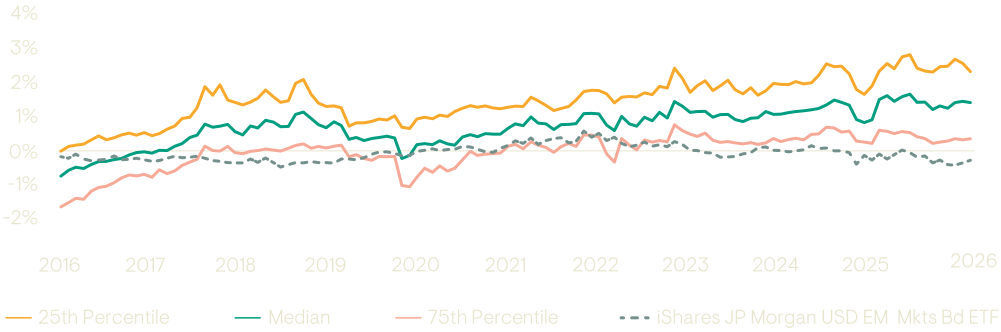
- On the hard currency side (Figure 2), top-quartile active managers have outperformed the index by up to 265bps over the period, gross of fees, and the median active manager has remained ahead of the index in every three-year window since May 2020.
Both hard and local currency active managers have delivered consistent excess returns (rolling three-year, gross)
Figure 1: EM local currency debt managers*
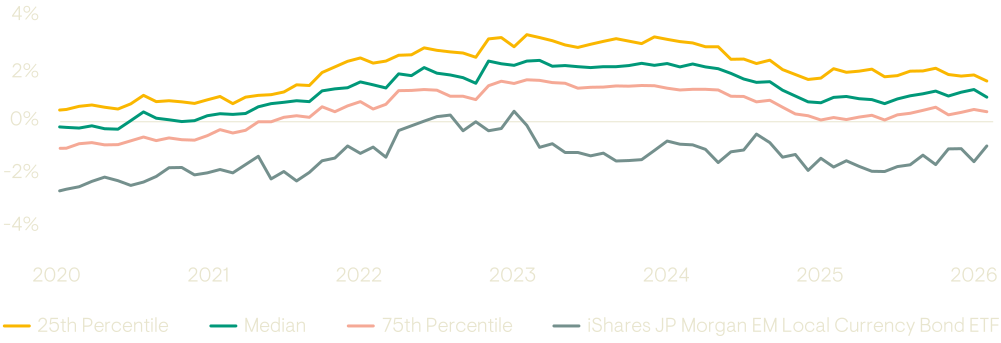
Figure 2: EM hard currency debt managers
Past performance does not predict future returns; losses may be made.
Source: eVestment, as at June 2026. *Shorter period presented as ETF switched benchmark in July 2017 from the Bloomberg EM Local Currency GD Index to the JPM GBI-EM Global Diversified 10% Cap Index. Hard currency: median active manager is calculated from the eVestment Global EM Fixed Income - Hard Currency Universe, USD, gross returns. Local currency: median active manager is calculated off the eVestment Global EM Fixed Income - Local Currency Universe, USD, gross returns.
How have active approaches fared over a longer time horizon?
Even for active managers with the relevant skills, tools and expertise, not all environments are conducive to alpha generation. When macro drivers dominate market moves, pushing dispersion down and correlations up, fundamentals-focused active investment approaches can struggle to generate alpha. At such times, the relative appeal of passive approaches rises, and the active/passive debate reignites.
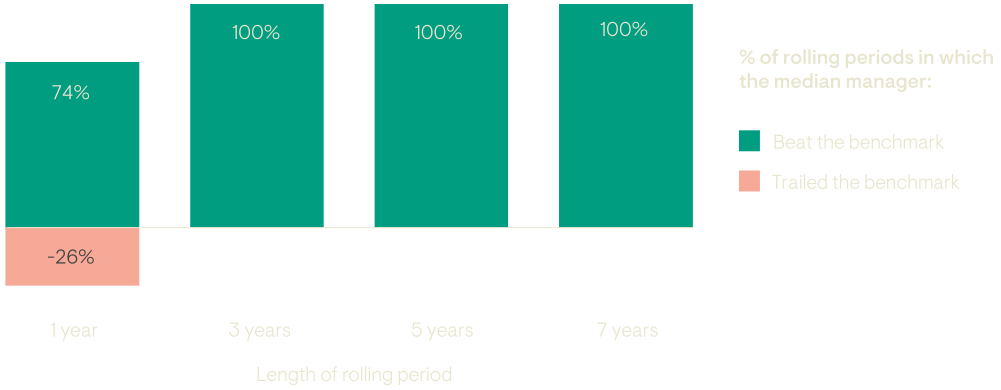
However, our analysis shows that consistency of active manager returns improves the longer the holding period. Looking at rolling 1-, 3-, 5- and 7-year returns over a 10-year window, the median active local currency manager outperformed the index in 65% of 1-year periods, rising to 100% over 7-year periods (Figure 3); hard currency managers showed an even sharper improvement, moving from 74% in 1-year periods to 100% by year 3 (Figure 4).
The case for active management tends to strengthen over longer time horizons
Figure 3: Local currency debt managers
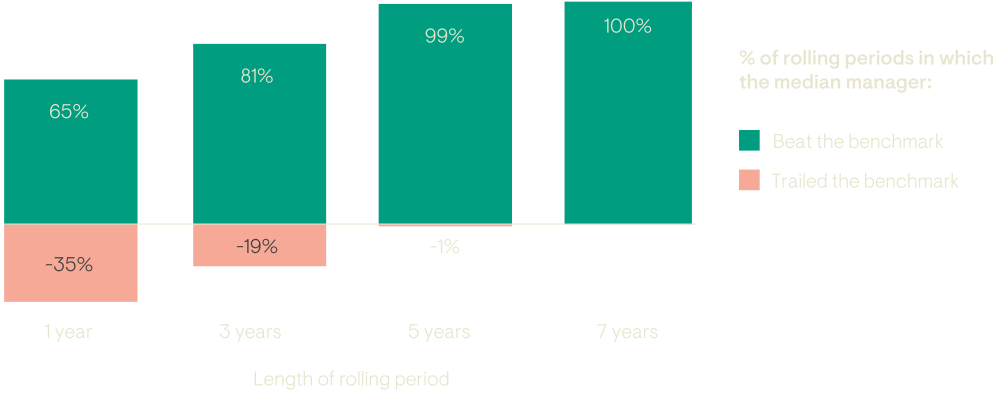
Figure 4: Hard currency debt managers
Past performance does not predict future returns; losses may be made.
Source: eVestment, USD, gross returns. Period covers 10 years from June 2016 to June 2026.
Dispersion within the active universe
While the above points to a broadly favourable comparison between active and passive, it is important to note the significant disparity of performance among active managers. For example, in the three years to June 2026, the top quartile of hard currency active managers outperformed passive by 243bps, compared with 36bps of outperformance for the bottom quartile – a gap of just over 2%. Local currency strategies show a similarly wide spread: the top quartile outperformed by 154bps, against 38bps of outperformance for the bottom quartile. The upshot is that asset allocators choosing to invest actively in the asset class need to carry out careful due diligence on managers. This is a complex investment universe to navigate and requires a specialist skill set.
Assessing the alpha-capture potential of the asset class
The EM debt universe is hugely diverse, encompassing over 70 countries, as we noted here, with associated investment strategies incorporating hard currency, local currency and corporate product offerings, as well as many combinations thereof.
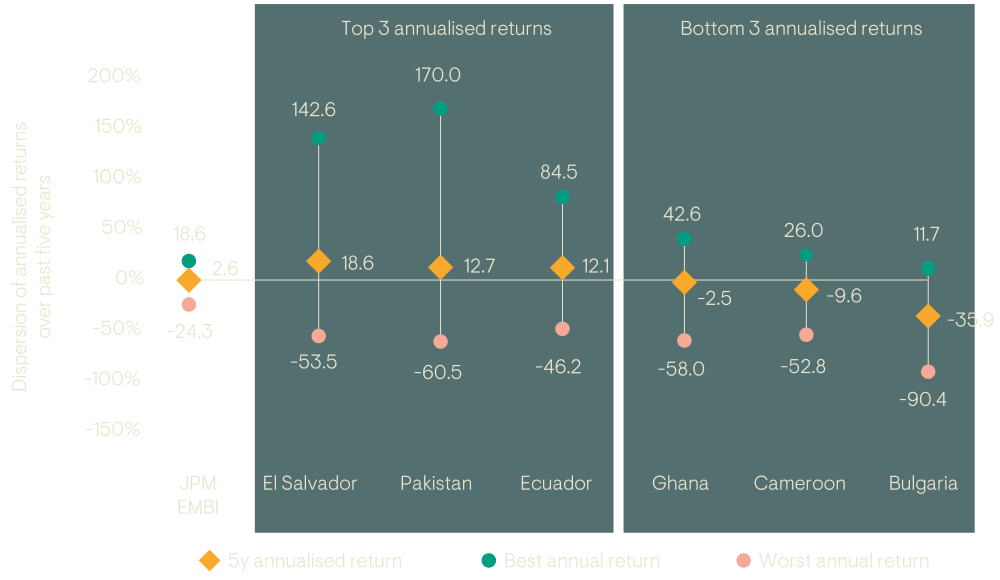
With high cross-sectional regional dispersion, the universe provides active managers with an ever-growing opportunity set to explore in pursuit of alpha. Figure 5 and Figure 6 illustrate this dispersion using a sample3 of countries within the JP Morgan GBI-EM Global Diversified index (local currency) and the JP Morgan EMBI Global Diversified index (hard currency) – the most widely followed EM benchmarks for local currency and hard currency debt strategies, respectively.
Wide return dispersions create rich opportunities for active managers
Figure 5: Local currency debt markets
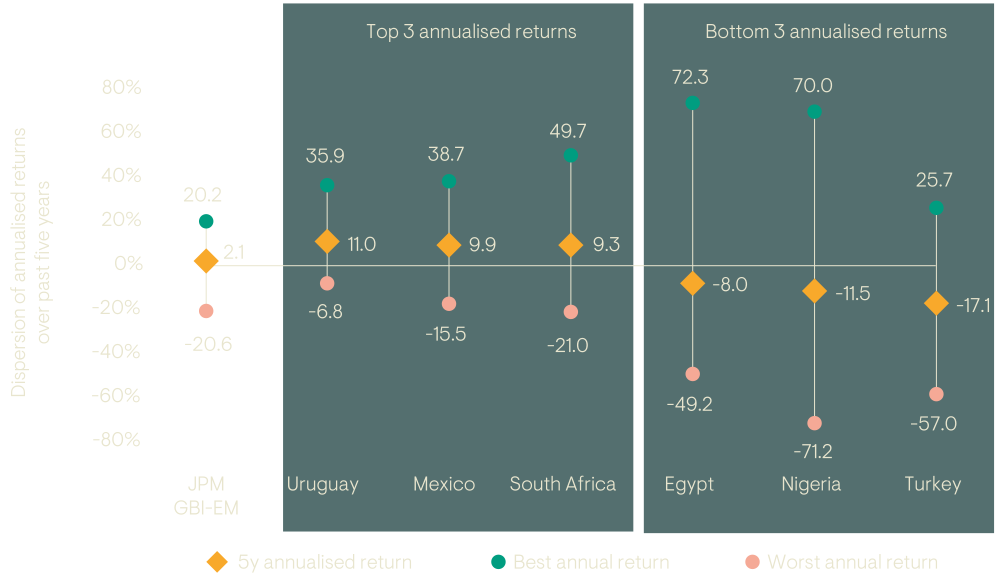
Figure 6: Hard currency debt markets ex-CCC
Past performance does not predict future returns; losses may be made.
Source: JP Morgan, Bloomberg, 30 June 2026. Five-year annualised return. Top and bottom 3 countries for the JP Morgan GBI-EM and EMBI indices. For illustrative purposes only. Five years used to encompass an economic cycle. For important information on indices, please see Important information section.
The dispersion in returns is stark. For example, on the local currency side, Nigeria has seen annual returns over the last five years range from -71.2% to +70.0%. Looking through a hard currency lens reveals similar divergences – El Salvador has swung across 196 percentage points between its best (+142.6%) and worst (-53.5%) year within the same five-year period. This reflects significant diversity of underlying fundamentals and drivers in these markets; this is an under-researched investment universe, rife with inefficiencies in market pricing and information asymmetry. These factors provide active managers with greater opportunity to generate alpha through market selection than in other, more widely researched markets.
Index evolution creates opportunities
The evolving nature of EM bond indices can also create opportunities for active managers. For example, India’s local currency bonds were phased into the JP Morgan GBI-EM Global Diversified index from 2024, reaching a 10% weight by March 2025. Managers who anticipated the resulting inflows from the change in index composition (the ‘passive bid’) could position ahead of inclusion and potentially benefit from the repricing. As the EM universe continues to broaden – with Saudi Arabia and the Philippines expected to begin a phased inclusion in early 2027 – similar opportunities are likely to arise.
Looking beyond the benchmark
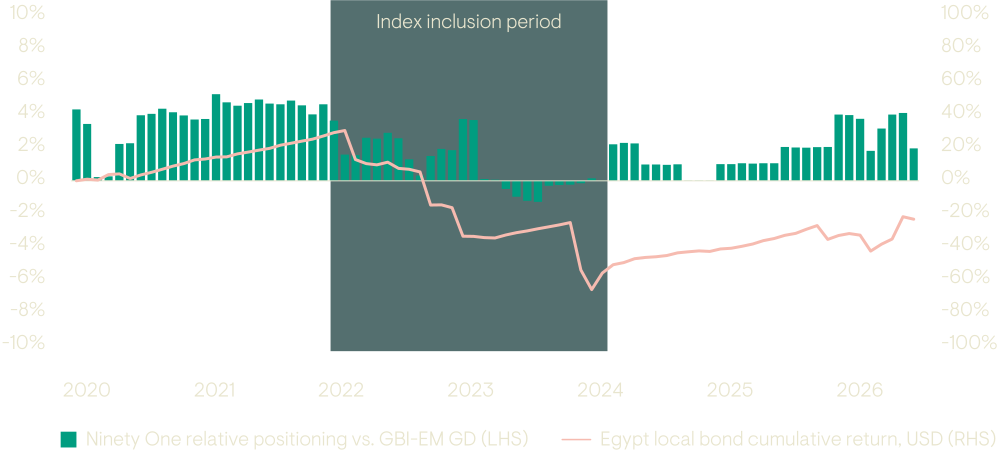
The EM local currency opportunity set spans roughly 40 countries, yet the index captures around 20. That leaves a large, under-researched off-benchmark universe — from frontier local markets such as Uganda to markets like South Korea that behave much more like emerging markets — where active managers can take positions based on a forward-looking assessment of risk and reward. Index inclusions, removals and eligibility changes can allow active managers to position ahead of the flow or step away when the risk-reward deteriorates. Egypt illustrates this well: the country was removed from the index shortly before its 2024 policy reset, so passive investors held it through the preceding drawdown but missed the strong recovery that followed.
Figure 7: Relative positioning in Egypt local currency bonds through the index inclusion and exclusion cycle
Past performance does not predict future returns; losses may be made.
Source: Ninety One, JP Morgan, Bloomberg, as at 30 June 2026. For illustrative purposes only.
Considerations around passive approaches
Benchmarks matter more than most investors realise
In EM debt investing, the major providers4 draw the boundaries of the EM local currency market differently – varying in which countries qualify for inclusion, how individual markets are weighted, and what minimum credit quality or market-accessibility standards apply. The result is that each index represents a different slice of the same underlying universe. This is in sharp contrast to asset classes such as US large-cap equities, where passive providers track a far more homogeneous opportunity set.
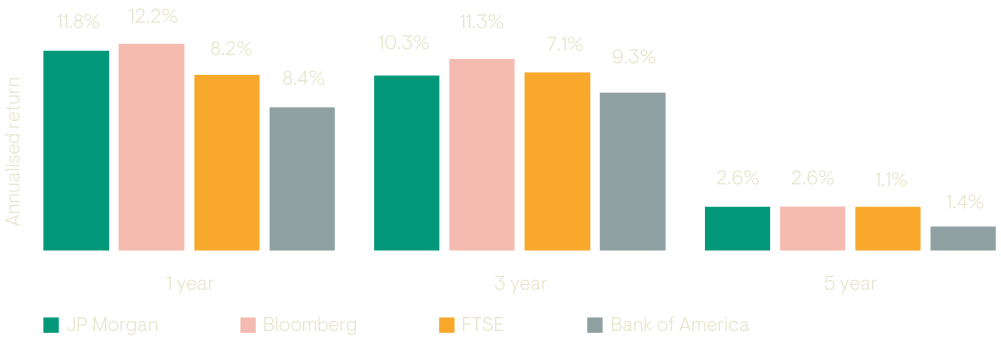
EM local currency indices have therefore delivered materially different returns through time. Over the five years to June 2026, the JP Morgan index outperformed the Bloomberg index by around 1.4% per annum. This dispersion is wider still over a one-year horizon, though narrower over three years, as shown below. This is driven by a combination of country inclusion factors as well as regional index weighting. For example, both the Bloomberg and the Bank of America indices have a larger regional skew to Asia, including South Korea at 10% index allocation. FTSE has a much smaller list of countries (17), removing countries such as the Czech Republic and excluding Uruguay and Paraguay, which are relatively recent additions to the JP Morgan index.
Therefore, selecting which index to track is an active decision in itself – the first active choice every EM debt investor makes, whether intentional or not.
Dispersion of index returns for different benchmark providers
Figure 8: Local currency index provider returns
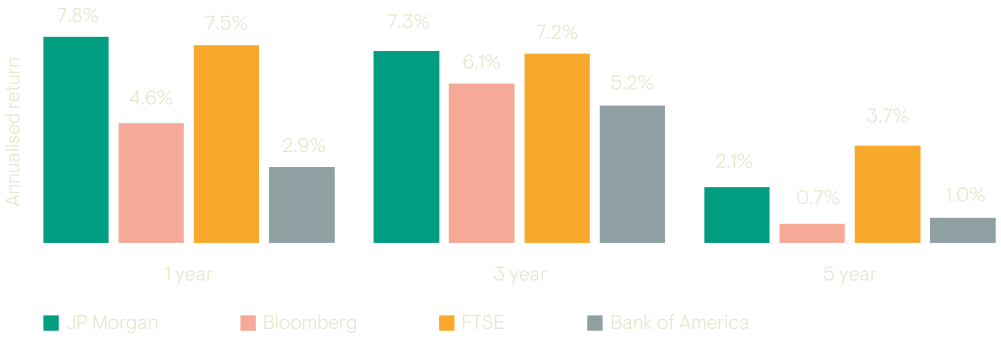
Figure 9: Hard currency index provider returns
Past performance does not predict future returns; losses may be made.
Source: Ninety One analysis, JP Morgan, Bloomberg, FTSE, ICE BofA, 30 June 2026. Five-year, three-year and one-year annualised return.
Index implementation is costly and imperfect
A passive vehicle does not guarantee investors the index return. A tracker has to be implemented, and in EM investing this can be costly and imperfect:
- Trading frictions: Matching the index means buying and selling across bid-offer spreads, paying brokerage and converting currencies. These can create slippage against the benchmark.
- Sampling rather than full replication: Passive providers often hold a representative sample of bonds rather than every single one.
- Cash drag: ETFs keep a cash buffer to handle redemptions, which dilutes returns compared to a fully invested index.
These problems can amplify in emerging markets, which tend to be less liquid and more volatile, with returns driven by several factors at once: local rates, carry and currency. Wider spreads, more frequent rebalancing and the practical implications of replicating an index exactly all push up tracking error and can erode the cost advantage that passive investing is supposed to offer.
More than meets the eye on costs
A frequently touted advantage of passive investment vehicles is their lower fees when compared to actively managed strategies. While this holds for some asset classes – fees can be as low as 0.02% for some US equity ETFs – in EM debt, the picture is less stark. According to our analysis of Morningstar’s passive local currency EM debt ETF peer group, the average expense ratio is 0.46% versus 1.19% for active funds; for hard currency strategies, the gap is similar, at 0.37% versus 1.00% for active, as shown in Figure 10 below.
Furthermore, while passive funds are still broadly cheaper, we question how the cost advantage stacks up relative to the historical and potential returns of active management. Figure 10 also reveals consistent outperformance by active strategies when comparing returns over various periods, and leads us to conclude that the cost advantage of passive approaches does not offset the value added through active management.
Figure 10: Fee and performance comparison of EM local and hard currency debt strategies
Performance net of fees (% annualised)
Past performance does not predict future returns; losses may be made.
Source: Morningstar Direct, June 2026. Net expenses and performance are based on simple averages of US dollar-denominated EM Debt ETFs and Active Manager products. For local currency, Morningstar category is US Emerging Markets Local Currency Bond (inc. ETFs) where the underlying benchmark is JP Morgan GBI-EM or equivalent Local Currency Index, sample size = 60. For hard currency, Morningstar category is US Emerging Market Bond Category (inc. ETFs) where the underlying benchmark is JP Morgan EMBI or equivalent Hard Currency index, sample size = 120.
The fact that fees on passive EM debt strategies are relatively high is perhaps unsurprising. EM debt is a complex and relatively costly asset class to invest in, regardless of the investment approach, making it more challenging than in other asset classes to offer low-cost products in this space. Emerging markets are typically less liquid and more volatile than developed markets – factors that can also lead to a higher tracking error for passive EM strategies. This is evident in the divergent performance of EM ETFs, which can deviate meaningfully from the benchmark – with annualised tracking errors ranging from 1.4% to 2.5% in the local currency market, and even more in the hard currency markets (up to 2.8%). Relative to other asset classes, the higher transaction costs, wider bid-offer spreads, frequent index rebalancing costs, and the inability to perfectly replicate the benchmark index are all factors that are more relevant in emerging markets and diminish the cost advantages of a passive investment approach, in our view.
In summary
While passive ETFs have grown in popularity as a low-cost way to access various asset classes, our analysis suggests that the average passive EM debt ETF has been unable to compete with the returns of an active manager or look beyond the benchmark in any meaningful way. Passive products are sub-optimal vehicles for accessing less liquid markets, have generally underperformed comparable active managers, and are limited to a constrained opportunity set. We firmly believe that active management, underpinned by the right expertise and toolkit, can help investors get the most out of the EM debt asset class.
Download PDF
1. Broadridge data as of 30 June 2026, compiled across EM hard currency, local currency, blended and corporate debt funds.
2. Rolling three years is the time period typically considered by our institutional clients.
3. The best and worst performers within the index over the most recent five-year period (to 30 June 2026).
4. Such as JP Morgan, Bloomberg, FTSE and Bank of America.
General risks. The value of investments, and any income generated from them, can fall as well as rise. Past performance does not predict future returns, losses may be made. Environmental, social or governance related risk events or factors, if they occur, could cause a negative impact on the value of investments.
Specific risks. Default: There is a risk that the issuers of fixed income investments (e.g. bonds) may not be able to meet interest payments nor repay the money they have borrowed. The worse the credit quality of the issuer, the greater the risk of default and therefore investment loss. Interest rate: The value of fixed income investments (e.g. bonds) tends to decrease when interest rates rise. Emerging market (inc. China): These markets carry a higher risk of financial loss than more developed markets as they may have less developed legal, political, economic or other systems. Currency: Where an investment is denominated in a currency other than the base currency of the fund or strategy, or invests in assets denominated in local emerging market currencies, changes in exchange rates may cause the value of the investment to decrease. Liquidity: In difficult market conditions, some securities held by a fund or strategy may become less liquid or hard to value, which may affect the ability to buy or sell at the desired time or price.
