Key takeaways
- The UK equity market remains attractive, but selectivity is crucial
2025’s UK equity gains were multiple-led rather than earnings led – shares got more expensive – which makes stock selection increasingly important. - The buyback capital of the world
The UK equity market continues to be one of the most shareholder friendly in the world, offering a compelling return from dividends, buybacks and M&A. - M&A validates the discount, but is bittersweet
Bids are landing at 55-60% premiums yet still imply double-digit returns, confirming the market remains cheap. - Structural selling pressure appears close to ending
Defined Contribution growth, ISA reforms and returning international allocators point to a structural flow tailwind ahead. - Value and Quality can capture the opportunity
We believe a portfolio built on a combination of ‘Quality’ and ‘Value’ can best capture the diverse range of bottom-up investment opportunities the UK offers, as well as the potential for a renaissance in the UK market in the coming years.
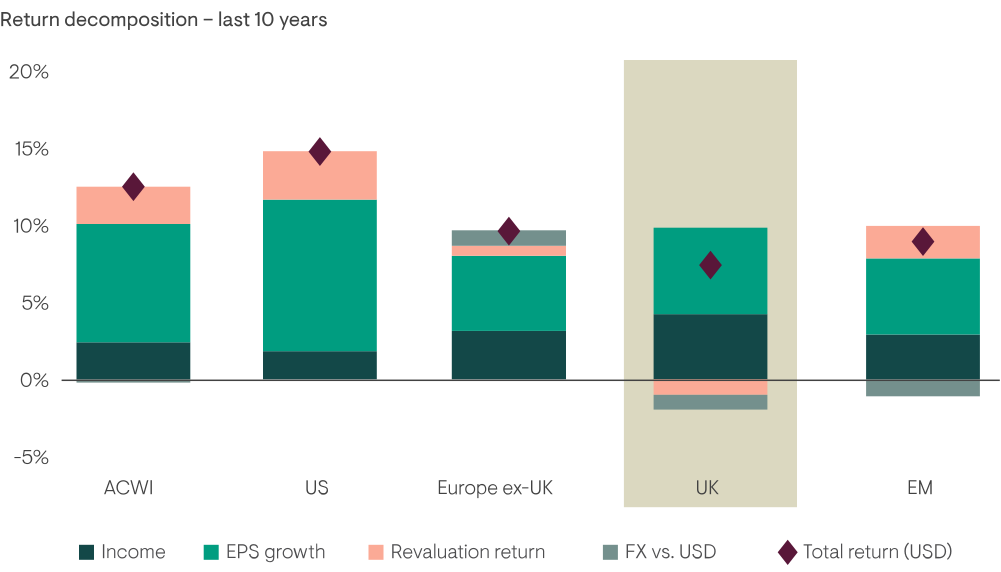
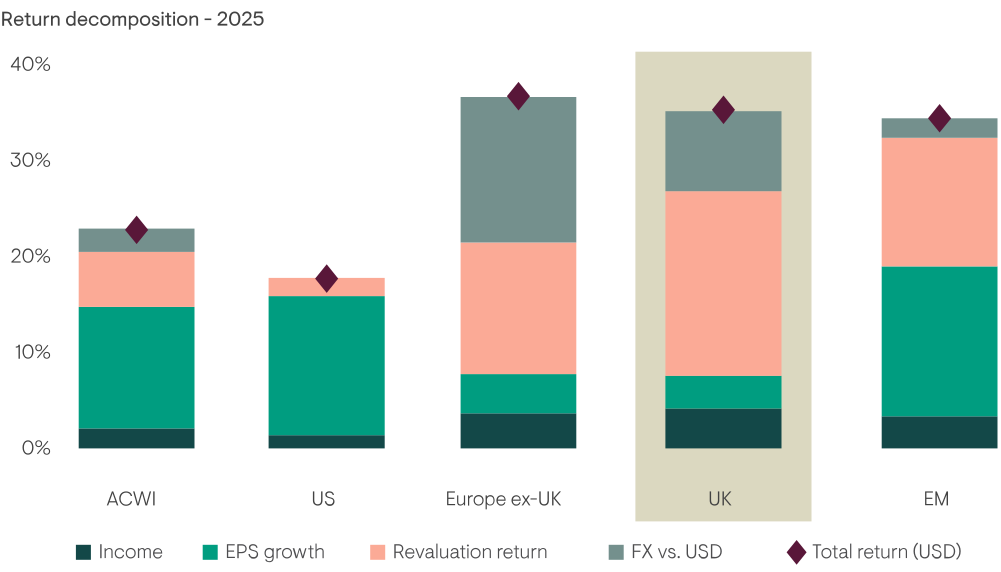
The UK equity market has had a solid time of it recently, backing up a double-digit return in 2025 with further gains so far this year. However, a striking aspect of this performance is that it has been mostly driven by multiple rerating – shares becoming more expensive – with modest earnings growth.
After a decade of sustained de-rating, financials, materials and defence led a sharp recovery in the market’s perception of the UK. However, now that many of these classic ‘old industry’ businesses have re-rated, the UK equity opportunity has become more heterogeneous, and that matters going forward. History shows that it is earnings and income that drive the bulk of shareholder returns, and to capture this, selectivity is crucial.
Figure 1: The UK’s recent performance composition doesn’t match its historical norm
Source: Ninety One, Bloomberg, December 2025.
One of the most interesting market dynamics in recent years has been the trajectory of traditional ‘quality’ businesses as cyclicals have recovered. While investors typically think of the UK as lacking in business quality, companies such as Experian, Sage and Autotrader1 – all capital-light, financially sound leaders in their field – have de-rated from around 28x to 14-15x free cash flow since 2019.
Their earnings, for the most part, continue to compound, but a combination of AI disruption concerns, quality fund outflows and persistent hedge fund short-selling pressure has repriced these businesses to levels that increasingly resemble value multiples rather than quality premiums.
Given this backdrop, it appears that the ‘easy wins’ from style rotation are less obvious than they were. Therefore, the more productive question is perhaps no longer growth versus value, or quality versus cyclical, but rather identifying where the market has been too pessimistic, regardless of equity style boxes.
The UK is one of the most shareholder-friendly markets in the world
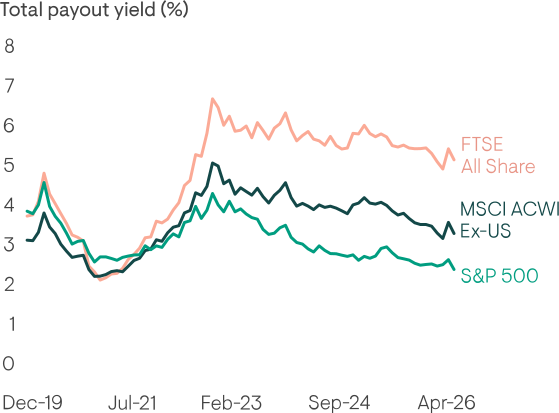
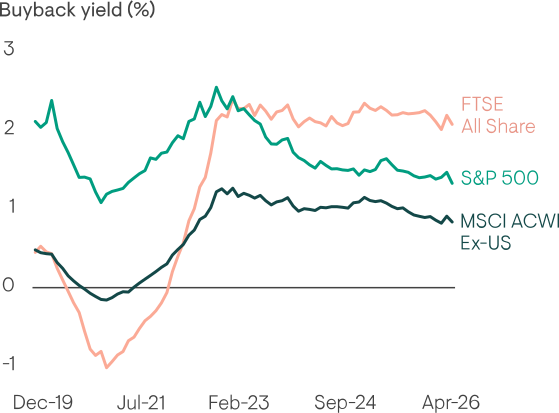
While much has been made of the UK equity market’s ‘decline’ of recent years, behind the scenes UK Plc has taken matters into its own hands and the UK has quietly become the buyback capital of the world. Today, discounting any re-rating, the UK offers around 8% in total shareholder returns before earnings growth is factored in. About 6% of this comes from payouts in the form of dividends and buybacks, with an additional 2% from M&A activity.
From this starting point, the UK offers the potential to capture further returns from earnings growth and capital returns, especially when the right companies are identified. After all, we would argue that the best investments are made when buying a growing stream of cash flows at a cheap price.
Figure 2: Behind the scenes, UK plcs are taking matters into their own hands
Source: Ninety One, Factset April 2026.
M&A validates the discount, but is bittersweet
A burst of deals this year has already lifted the total value of acquisitions above 2025 levels, with FTSE 100 bids coming in at 55-60% premiums. In fact, the first half of 2026 has been the strongest for purchases of UK companies by foreign buyers in almost two decades, according to the London Stock Exchange. Companies from both the value and quality universes have been subject to bids this year, including DCC, Beazley and Intertek.
Our take on this is somewhat nuanced. Even at the bid price, our analysis suggests potential annual returns for these excellent businesses are still in double-digit territory, so acquirers are bidding at just the right level to secure acceptance from frustrated shareholders, capturing companies at well below their fair value.
Figure 3: UK M&A deal value already matching 2025 with average of closed bids 53%
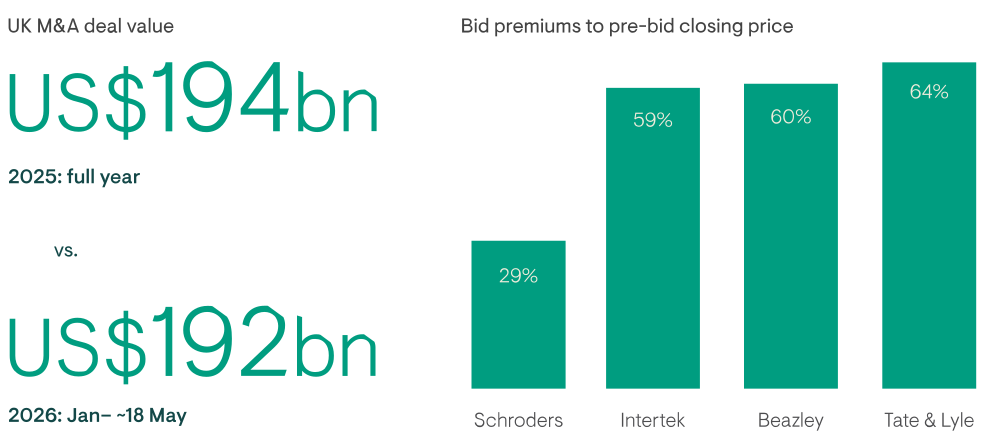
Source: Ninety One, Reuters, LSEG, Bloomberg, June 2026.
The structural selling pressure seems close to exhausted
A structural evolution in the UK’s pensions and investment landscape should be another tailwind for UK equities in the years ahead. The UK’s Defined Benefit pension market is in managed decline – schemes are closing faster than they are opening, active membership has fallen 80% since 2006, and the remaining 4,800 schemes are steadily transferring their liabilities to insurers at a rate of £45-50 billion a year.2
These domestic outflows caused by de-risking – moving from equities to bonds – have been a persistent headwind for the past 20-30 years. Defined Benefit schemes’ allocation to UK equities dropped from 57% in 1993 to 48% by 2000, 31% by 2010, 16% by 2015 and just 6% by 2022, while bonds rose from 10% to a record 58.5% over the same period.3
The process of Defined Benefit de-risking is close to being complete; Defined Contribution assets are growing, ISA reforms encouraging UK investments should channel more retail capital into equities, and international investors are actively re-engaging after years of steering clear given recent outperformance and ex-US options being more widely considered. All of these factors point towards a structural tailwind for flows for the years ahead.
Closing thoughts
Overall, we remain optimistic on the outlook for UK equities. The UK continues to be home to a collection of globally leading businesses, diversified by industry and region, that continue to trade at relatively attractive valuations compared to global peers. Shareholder returns in the form of buybacks and dividends remain significantly above those available in other major markets, providing a strong foundation for future returns without any requirement for further re-rating.
With valuation dispersion increasing within sectors and cyclicals having performed strongly, we think selectivity is increasingly important. Both quality and value are two distinct yet complementary active investment approaches to accessing what the UK has to offer – in a market where the technical and structural backdrop is showing genuine signs of improvement. After more than a decade in the doldrums, this shift may prove to be a crucial turning point.
No representation is being made that any investment will or is likely to achieve profits or losses similar to those achieved in the past, or that significant losses will be avoided.
1 This is not a buy, sell or hold recommendation for any particular security. For further information on specific portfolio names, please see the Important information section.
2 The Investment Association
3 Interactive Investor
General risks. The value of investments, and any income generated from them, can fall as well as rise. Where charges are taken from capital, this may constrain future growth. Past performance is not a reliable indicator of future results. If any currency differs from the investor’s home currency, returns may increase or decrease as a result of currency fluctuations. Investment objectives and performance targets are subject to change and may not necessarily be achieved, losses may be made. Environmental, social or governance related risk events or factors, if they occur, could cause a negative impact on the value of investments.
Specific risks. Geographic/Sector: Investments may be primarily concentrated in specific countries, geographical regions and/or industry sectors. This may result in wider fluctuations in the value of the portfolio compared to more broadly invested portfolios. Equity investment: The value of equities (e.g. shares) and equity-related investments may vary according to company profits and future prospects as well as more general market factors. In the event of a company default (e.g. insolvency), the owners of their equity rank last in terms of any financial payment from that company. Style Bias: The use of a specific investment style or philosophy can result in particular portfolio characteristics that are different to more broadly-invested portfolios. These differences may mean that, in certain market conditions, the value of the portfolio may decrease while more broadly-invested portfolios might grow.
