Key takeaways
- Treating the UK as a capital cycle: Every capital cycle starts the same way: an industry falls out of favour, capital withdraws indiscriminately, and prices stop tracking fundamentals. That is where the UK is right now, but there are reasons to be positive.
- The forced seller is exhausted: Two decades of defined benefit pension de-risking drove indiscriminate selling that decoupled price from fundamentals. With most of that structural selling now done, the UK looks closer to the trough of its capital cycle than the peak.
- Rational capital is already responding: Three signals point the same way: UK plc running some of the highest buybacks globally, a thin new-listing pipeline as companies opt not to list at UK valuations, and a wave of take-private M&A at steep premiums.
- The return equation is well supported: Leading dividend yields and buybacks coupled with earnings growth offer an attractive total shareholder return whilst M&A premiums also highlight the potential for a rerating. The latter is essentially a free option.
- An opportunity hiding in plain sight: As valuations recover, M&A economics and buyback appeal will fade; the cycle that creates today's opportunity will eventually close it. But we are closer to the beginning than the end. Rarely is the pathway to returns this well supported from as many directions at once.
Building a case for the UK
The malaise of the UK equity market is so frequently referenced that, at first glance, there feels very little new left to say.
But let us stop you right there. Rather than arguing that politics or a renewed sense of national identity will ride to the rescue of UK capital markets, we want to focus on the evidence. We think it suggests that the prospective returns on offer in UK equities remain attractive – building on their strong headline performance since the start of 2025 – and that a UK allocation rightly deserves its place in the portfolios of UK and global allocators.
The core of the argument comes down to treating the UK as a capital cycle. That framing is inevitably reductionist, but we think it captures the current backdrop for UK equity investors more clearly than other lenses. We will walk through it in stages: how the market became unloved; how rational capital has responded to this dynamic; and what all of that offers UK equity investors today.
Stage one: how the UK became unloved
Every capital cycle starts the same way: an industry falls out of favour, capital withdraws indiscriminately, and prices stop tracking fundamentals. That is where the UK is right now. To understand how we got here, it's worth revisiting a brief history.
A powerhouse that lost its shine
For a country that, not so long ago, dominated global indices and created some of the world's largest and longest-running listed businesses, negativity has become part of the system. Whether that is the British knack for pessimism, the self-inflicted decision-making of successive governments, or the rise of the so-called 'moron premium' thanks to persistently elevated borrowing costs, the UK stock market has lost its shine.
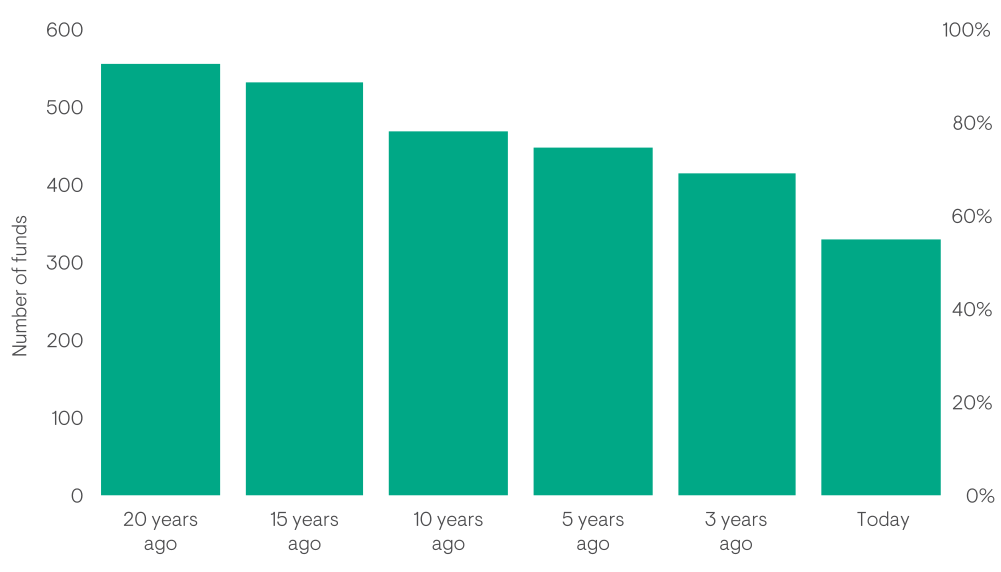
We have seen the de-listing of posterchild technology businesses such as Wise and Arm, while listed company numbers have roughly halved in the past two decades. The new-issuance pipeline has been thin, and the exchange looks structurally diminished. This has been reflected in net outflows within the UK All-Share peer group, which have totalled some £90 billion in the past five years, with £19 billion flowing out in the past 12 months alone.1 The fund management industry, and therefore the choice for allocators, has also markedly shrunk. In the past 20 years, the number of active UK-focused funds has fallen by >40% to 330 whilst the universe has shrunk by 25% in the past five years.
Figure 1: The number of UK funds has steadily decreased over the past 20 years
Source: Morningstar, Ninety One, August 2026.
The clearest mechanism behind the collapse of UK allocations is the two-decade run of defined benefit de-risking. UK pension schemes' allocation to domestic equities collapsed from 57% in 1993 to just 6% by 2022,2 with the balance rotated into bonds and, more recently, transferred wholesale to insurers. A similar pattern has played out across the UK wealth market with allocators compelled to not deviate from benchmarks and the UK concurrently becoming a smaller part of the overall jigsaw.
Could exhaustion present an opportunity?
An obvious and very fair question is: what makes this moment any different to the experience of the last decade? We do not pretend to call a particular turning point but rather point to a gradual exhaustion of the structural seller. There is simply very little left to sell. The marginal seller in UK equities is a spent force, or close enough to it that the distinction no longer matters for the argument.
Where does that leave us? With the majority of the selling done, we would argue that we are closer to the bottom of this capital cycle than the top. And that is not a bad place to start thinking about UK equity allocations.
At this point, it also feels worthwhile addressing two common misconceptions we hear from those considering allocations to the UK: firstly, that a UK allocation means taking a bet on an underwhelming UK economy, and secondly, that the marketplace itself, the London Stock Exchange, is in structural decline.
What gets lost inside the declining-economy narrative is that the UK remains home to a deep, diverse collection of globally leading businesses, trading at valuations that are, in general, cheaper than almost any other developed market. And as has been well documented, underlying revenues across the FTSE 100 are actually c.70% derived from outside the UK.3 As for the second misconception: the health of the UK index and the returns investors actually experience may, if anything, run in opposite directions. As we will discuss, investors in the UK stand to be well rewarded even as the index itself continues to shrink.
Stage two: a rational response
Against that backdrop, it is worth understanding how capital in the UK has reacted. In short, it has been entirely rational. We split the reaction into three: the response of currently listed UK plc, the response of UK-domiciled companies that could list but haven't, and that of private capital. Two of these have been vociferously debated while one has gone under the radar. What all three factors share is the same signal, coming from different directions: informed, price-sensitive capital pricing UK equities on fundamentals.
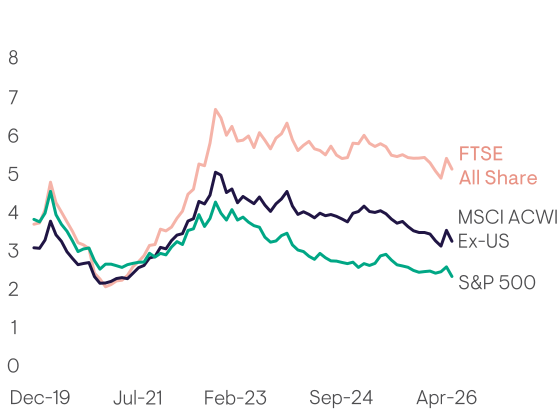
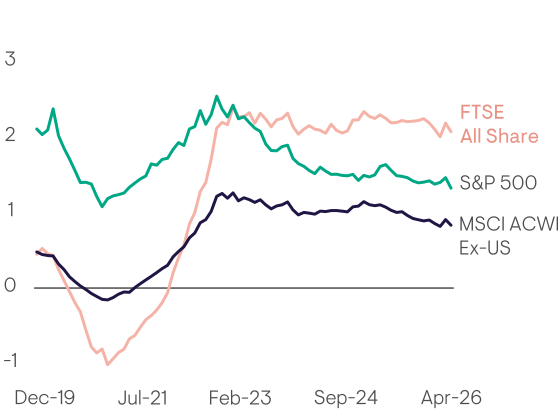
Starting with the silent one: the UK market has quietly become one of the most shareholder-friendly destinations for capital anywhere, and buybacks are the reason. The UK market now runs one of the highest buyback yields of any major market. UK banks over the last five years are perhaps the clearest illustration: sustained repurchases were a material part of financials' re-rating from a decade of de-rating, and the sector now trades at levels that look reasonable rather than distressed. The playbook worked there; it has also exposed how much of the wider market, outside the financials, materials and defence names that led a market recovery in the last five years in the UK, remains unloved, despite continuing to retire shares at a significant rate.
Figure 2: Behind the scenes, UK plcs are taking matters into their own hands
Total payout yield (%)
Buyback yield (%)
Source: Ninety One, FactSet April 2026.
The second reaction – companies choosing not to list in the UK at all – is a rational response too. Lower UK valuations mean a smaller reward for listing here than in the US. Think of Arm Holdings,4 a fixture of the British stock market before being taken over by SoftBank in 2016. Its 2023 return saw the company courted by the UK government, but it chose the US as its listing venue. Klarna, which was founded in Sweden but has a London headquarters, selected New York over London in late 2024, while London-based commodities broker Marex took that route earlier in the same year. Data from Morningstar suggests that the share of UK businesses listing at home fell from 71% in 2019 to 46% in 2025.
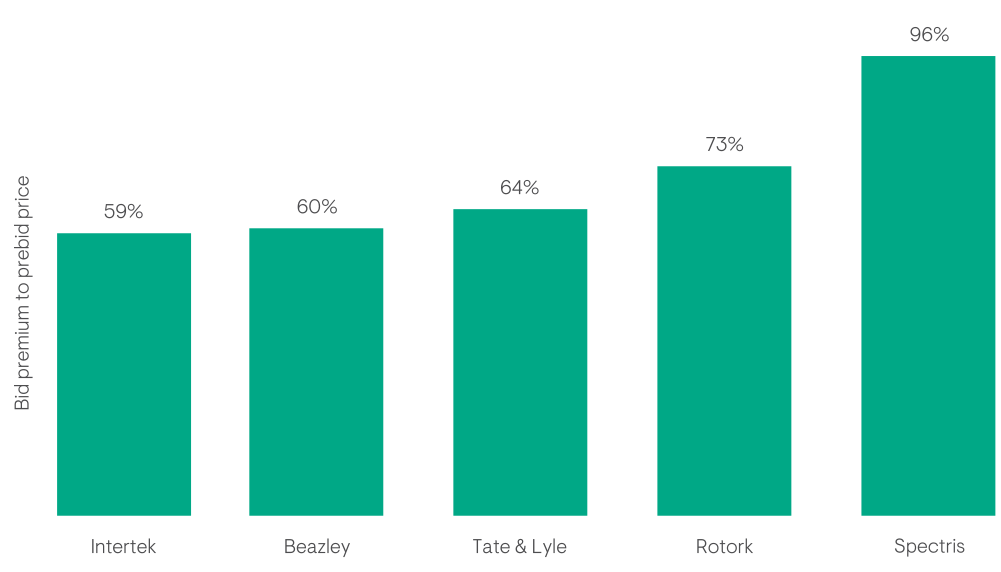
The third reaction has dominated headlines this year: M&A. At the halfway point of 2026, UK M&A already matched the entirety of 2025's tally, with deal values running at about US$192 billion.5 The London Stock Exchange has confirmed the six months to June 2026 was the strongest half-year for foreign purchases of UK companies in almost two decades. Yet it is not only the volume of deals that has surprised; it is the control premiums (the amount the buyer pays above the market valuation to take control of a business). A historical average of about 25% has been routinely doubled as a starting point: 59% for Intertek, 60% for Beazley, 64% for Tate & Lyle, and 73% for Rotork, taking a handful of examples from this year alone. The takeover of Spectris in 2025 landed at a premium of 96%. What does all of this mean? We take this as one of the clearest signs that pricing has become detached from fundamentals. Why else would private capital, international investors and trade buyers value UK companies at such premiums to the prevailing share price?
Figure 3: Recent UK take-private bid premiums have been above the historical norm
Source: Ninety One, Reuters, LSEG, Bloomberg, June 2026.
A bittersweet reality
Watching high-quality, well-run businesses taken private is bittersweet. Companies leaving the index is bad for the depth and health of the UK market as a national asset class, but it doesn't make UK equities a weaker proposition; a reducing share count paired with genuine M&A optionality is one of the more supportive backdrops for prospective returns. It could even be the very mechanism that eventually shifts perception of the entire market. The discount is real and buyers are proving it with their own capital; our role, as investors in UK public markets, lies in separating what is cheap because it has been tarnished by the 'UK brush' from what is cheap because it deserves to be.
All three reactions can be expressed in a single measurable number: net issuance. When more shares leave (through buybacks and takeovers) than arrive (through new listings and secondary offerings), net issuance is negative and returns get a lift. When more shares arrive than leave, the reverse happens.
Ninety One's Investment Institute has studied this across markets for a number of years. Emerging markets show the drag clearly: between 2014 and 2024, heavy IPO issuance and index-inclusion events cost EM investors close to six percentage points of return a year. That drag has eased sharply since, particularly in China, as issuance has thinned and buybacks have picked up.
In this recent paper looking at the US market, the contribution of net issuance to returns peaked at +1.9% in 2017, turned negative between 2021 and 2023, and has been back in positive territory since then. Ultimately, however, the bigger risk may lie ahead: continued fundraising from SpaceX, potential public listings from Anthropic and OpenAI, and a shift among several hyperscalers from buybacks toward fresh share issuance to fund AI capital spending could pull that number down further.
The UK sits at the opposite end of that spectrum, by a wide margin. On a two-year rolling basis, the contribution of UK net issuance to returns reached +3.6% in May 2026, approaching the highest reading in the 15 years of data we track and the strongest of any major market. As recently as 2023, it was close to zero; the shift has happened quickly, and it has been significant.
Figure 4: A reduced number of shares has contributed to UK returns
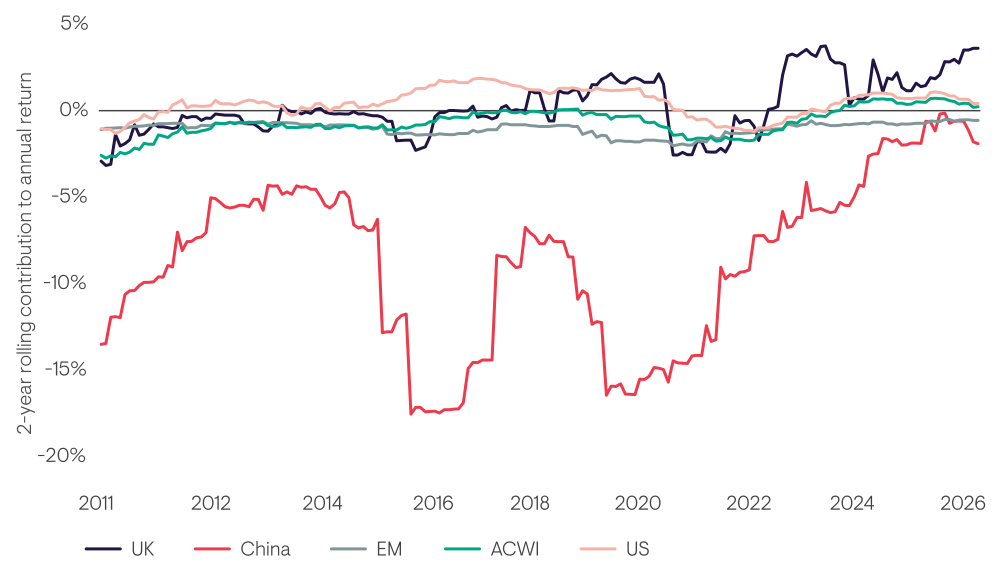
Source: Ninety One Capital Market Assumptions, Bloomberg. 2-year rolling annualised contribution to total return, local currency (GBP for UK). Data from January 2011 (the earliest full 2-year rolling observation) to May 2026.
Looking at the UK's own recent history, we have a good example of this dynamic in reverse. In 2021, higher valuations and a warmer reception for new issuance produced a wave of UK listings at full prices – and distinctly poor subsequent performance followed. Rising supply preceded weak returns then. Thin supply now, combined with buybacks and M&A running at record levels, is the same mechanism working in reverse.
Stage three: the UK equity return equation
Arguably, much of the above is irrelevant if the key metric for investors, returns, does not follow. There are three pillars that complete any return equation – income, revaluation and earnings growth – and we will review how each of these pillars is placed heading into the final stretch of 2026.
Cash return (dividends + buybacks)
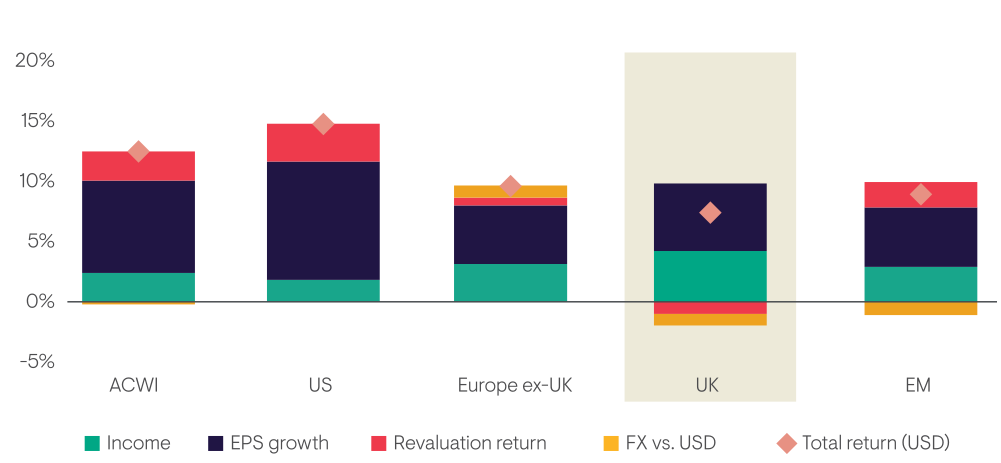
The UK has always been known for its dividend culture, and yields at the index level remain well above global peers. While not necessarily the most exciting part of the return equation, it remains a significant one. Looking at total return – including dividends – shows just how much they contribute to the return profile of UK equities. Combined with the buyback culture that has developed since 2022, this means a sizeable part of the return equation is already in place, with no dependence on sentiment shifting in the UK's favour.
Revaluation
While a decomposition of equity returns in 2025 shows a cyclical re-rating contributing to UK equity returns, this must be put in the context of a 10-year de-rating. The M&A premiums discussed above are the clearest evidence that meaningful re-rating room remains even after last year's gains. Within our own portfolios (UK Franchise & UK Special Situations) over the last five years we have seen bids for c.10% of holdings, at an average 56% premium – further confirmation, beyond the handful of headline names already mentioned, of how highly strategic buyers are valuing high-quality UK businesses. Analysis of these businesses suggests acquirers are securing double-digit prospective annual returns, even taking into account the aforementioned control premium. Acquirers are bidding just enough to secure shareholder acceptance, while still capturing the business well below fair value.
Figure 5: The UK's recent performance composition doesn't match its historical norm
Return decomposition – last 10 years
Return decomposition – 2025
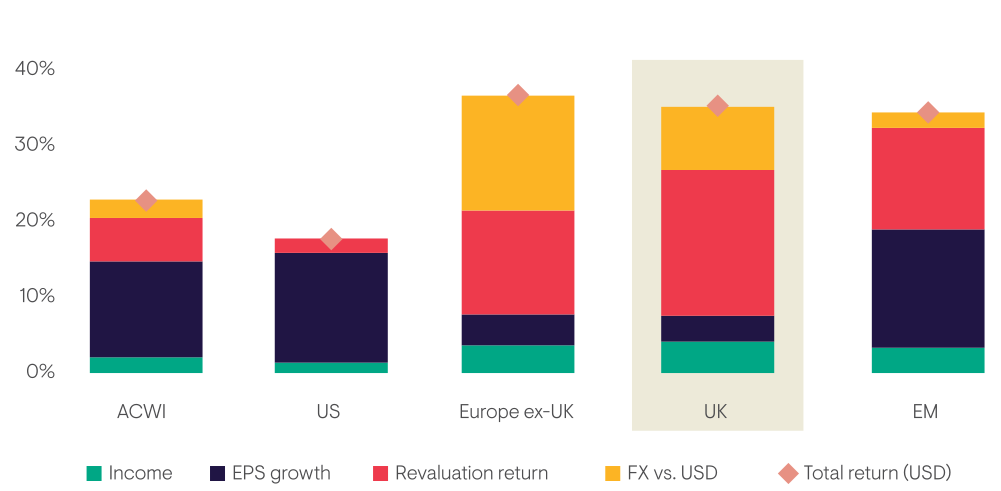
Source: Ninety One, Bloomberg, December 2025.
Growth
The lazy narrative sometimes attached to the UK is that it is a market short of quality-growth businesses: heavy in banks, energy and mining, light on compounders. Our experience tells a more nuanced story: a cohort of genuinely capital-light, financially sound UK leaders have de-rated from multiples in the high-20s to the mid-teens on a free-cashflow basis since 2019, even as their earnings have, for the most part, continued to compound. AI-disruption concerns, quality equity fund outflows and persistent short-selling pressure have pushed businesses that would command quality premiums elsewhere down to multiples that increasingly resemble value. That is not the UK lacking quality; it is quality being indiscriminately repriced alongside everything else. We think this is precisely the condition under which selective stock-picking earns its keep.
The more important point is how little growth UK equities need at the moment to generate competitive returns, given the strength of the other pillars. Even marginal growth lifts the return equation to an attractive hurdle rate. Any earnings growth the market is currently choosing to ignore is, in that sense, a free option on quality businesses being mispriced.
An opportunity hiding in plain sight
Every capital cycle ends, and this one will be no different. As valuations recover, the economics of M&A become less compelling for acquirers, and buyback programmes become less appealing on fully valued stocks. Rating recovery and M&A activity are, to some degree, mutually exclusive over the medium term. However, we believe we are closer to the beginning of this cycle than the end.
The UK became unloved at the hands of a forced seller with little regard for value; that seller is exhausted. Rational capital has responded: UK plc is buying back its own shares, would-be issuers are staying on the sidelines, and acquirers are paying up through M&A. In addition, cash returns and growth are, between them, already building a potential return most markets would consider well supported before a single catalyst arrives to drive any potential re-rating. Rarely is the pathway to returns this well supported from as many directions at once.
It is undeniably bittersweet watching high-quality UK businesses taken private one by one. But that process may be precisely what is needed for market perception to change. Capital that has shunned its home market is increasingly missing a significant return story that is now hiding in plain sight. With the capital cycle somewhere near its lowest point, this is surely the time to take another look at UK equities.
1 Source: Investment Association as of September 2026.
2 Interactive Investor.
3 London Stock Exchange Group.
4 This is not a buy, sell or hold recommendation for any particular security. For further information on specific portfolio names, please see the Important information section.
5 Source: Ninety One, Reuters, LSEG, Bloomberg, June 2026.
General risks. The value of investments, and any income generated from them, can fall as well as rise. Where charges are taken from capital, this may constrain future growth. Past performance is not a reliable indicator of future results. If any currency differs from the investor's home currency, returns may increase or decrease as a result of currency fluctuations. Investment objectives and performance targets are subject to change and may not necessarily be achieved, losses may be made. Environmental, social or governance related risk events or factors, if they occur, could cause a negative impact on the value of investments.
Specific risks. Geographic/Sector: Investments may be primarily concentrated in specific countries, geographical regions and/or industry sectors. This may result in wider fluctuations in the value of the portfolio compared to more broadly invested portfolios. Equity investment: The value of equities (e.g. shares) and equity-related investments may vary according to company profits and future prospects as well as more general market factors. In the event of a company default (e.g. insolvency), the owners of their equity rank last in terms of any financial payment from that company. Style Bias: The use of a specific investment style or philosophy can result in particular portfolio characteristics that are different to more broadly-invested portfolios. These differences may mean that, in certain market conditions, the value of the portfolio may decrease while more broadly-invested portfolios might grow.
