Why it's time to rewrite the EM debt story
EM debt has been gaining increasing attention among global institutional investors. But some Australian superannuation schemes still believe that the tracking error is not worth taking.
Here, we revisit the investment case for an asset class that is both coming of age and increasingly relevant in a more correlated world. We reassess the unique advantage Australian investors have in EM local currency debt, given the historically high correlation between EMFX and the AUD. From there, we set out three different routes for accessing the asset class within the confines of the Your Future, Your Super (YFYS) regulation.
All of this leads us to a clear conclusion: the risks associated with EM debt allocations are both overestimated by many investors and well worth taking.
Revisiting the investment case
Highly relevant in the new investment reality
In just a few years, the global investment landscape has undergone a profound shift, with significant implications for portfolios. Signs of a regime shift in bond markets began to emerge in 2022; sell-offs and volatility spikes in what were some of the world's safest havens revealed a blurring of lines between emerging and developed markets, or the 'EM'ification of DM'. Since then, evidence pointing to a new regime in bond markets has continued to grow.
In tandem, the macroeconomic environment has also shifted. A succession of 'supply shocks' has hit the global economy in recent years. Historically, EM assets have borne the brunt of these, but more recently, their resilience has shone out. From the post-COVID energy/inflation shock to the 2025 trade tariffs and the 2026 Middle East conflict, any initial EM sell-off has been short-lived, with EM outperformance ensuing. This is testament to EM debt evolving into a more mature and resilient asset class.
Best of both worlds when investing in Aussie dollars
A key consideration for Australian investors assessing the asset class is that the Australian dollar behaves as a natural hedge. The result is a materially better risk-adjusted outcome for Australian investors than for other G10 currency investors such as the EUR, GBP and USD – a structural advantage that stems purely from an investor's home currency.
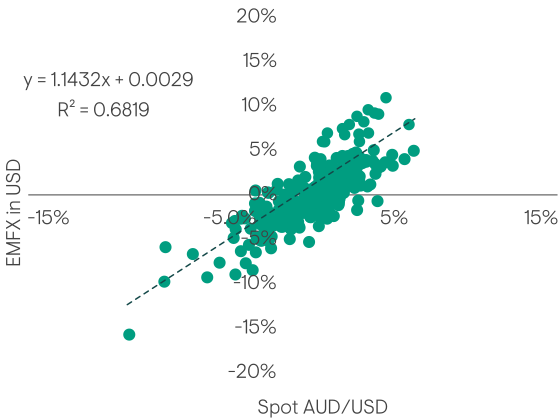
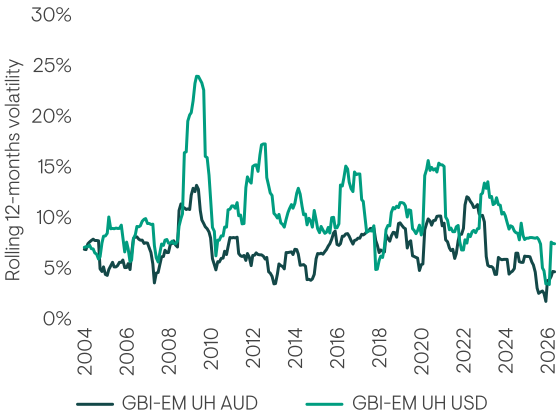
For context, the Australian dollar is a high-beta, commodity-linked currency whose performance is closely tied to global risk appetite and the EM cycle. For over 20 years, the relationship between EM currencies and the Australian dollar has been both strong and stable (as shown in the figure on the left). Put simply, when EM currencies weaken against the US dollar, the Australian dollar has tended to weaken alongside them. For investors in unhedged local currency EM debt, that translates into a less volatile experience than that of US-dollar (figure on the right) or Euro based investors. Over periods of negative local currency returns measured in US dollars, the Australian dollar has typically fallen too, cushioning, and often reversing, the loss once translated back into Australian dollars.
Over the past 23 years, holding local currency EM debt unhedged reduced its annualised volatility for an Australian investor from around 11% in US dollar terms to below 8% in Australian dollar terms, for only a modest give-up in return.
The AUD is closely correlated with EMFX…
…reducing the volatility of EM local currency debt
Taking a broader asset-class perspective, this currency benefit is specific to the local currency portion of the EM debt investment universe. For hard currency (US dollar-denominated) EM debt, the same relationship works in the opposite direction, slightly increasing volatility in Australian dollar terms, so hedging the US dollar exposure back to Australian dollars is generally the more efficient choice.
Acknowledging the risks
The Australian dollar's correlation with EM currencies is a beta relationship, not a guarantee. It has held because the AUD has traded predominantly as a high-beta, commodity-linked, risk-sensitive currency over the 23-year life of the JP Morgan GBI-EM index. A weakening in that behaviour would correspondingly reduce the currency cushion.
Two forces could drive that shift: AUD/USD becoming more domestically driven (Reserve Bank of Australia's policy, or the housing/inflation cycle) – or a divergence between Australia's terms-of-trade profile and the broader EM growth cycle. Either case could mean the usual cushion for AUD weakness may fail to show up when needed most.
These episodes are not the norm, but they are not without precedent: 2010 (RBA hiking cycle), 2020 (iron ore-driven AUD rebound on China stimulus), and 2026 (RBA hiking) all saw the relationship diverge. The 23-year history is a reasonable base case, not a guarantee across all regimes, suggesting allocators should treat the AUD/EMFX relationship as a supportive tailwind rather than a given.
The flexibility of EM debt is useful here, as investors can lean on multiple building blocks with different return drivers (as detailed below) to construct a portfolio less reliant on the AUD/EMFX relationship. At Ninety One, our EM debt portfolios are routinely built by blending these components to meet specific client requirements, including tailored currency hedge ratios.
Source: Ninety One, JPMorgan. Based on monthly return data over 23 years to June 2026. AUD/USD spot and EMFX return profile. For further information on indices, please see the important information section.
An asset class with significant yield and spread advantages
While not unique to Australian investors, the yield and spread advantages of EM debt remain a core part of the investment case. As shown in the figures below, on a like-for-like rating basis, yields on investment-grade and high-yield EM hard currency sovereign and corporate debt – as well as local currency EM sovereign debt – exceed their developed market counterparts.
The spread comparison tells a similar story. The EM hard currency corporate and sovereign market spans the full rating spectrum, roughly event split between investment grade and high yield. Comparing each segment to developed market high-yield and investment-grade benchmarks reveals a wider spread for the EM debt counterparts. More broadly, EM spreads, both sovereign and corporate, continue to offer greater compensation than comparable global high-yield and investment-grade credit, even after adjusting for rating.
EM debt markets compare favourably on both yield and spread levels
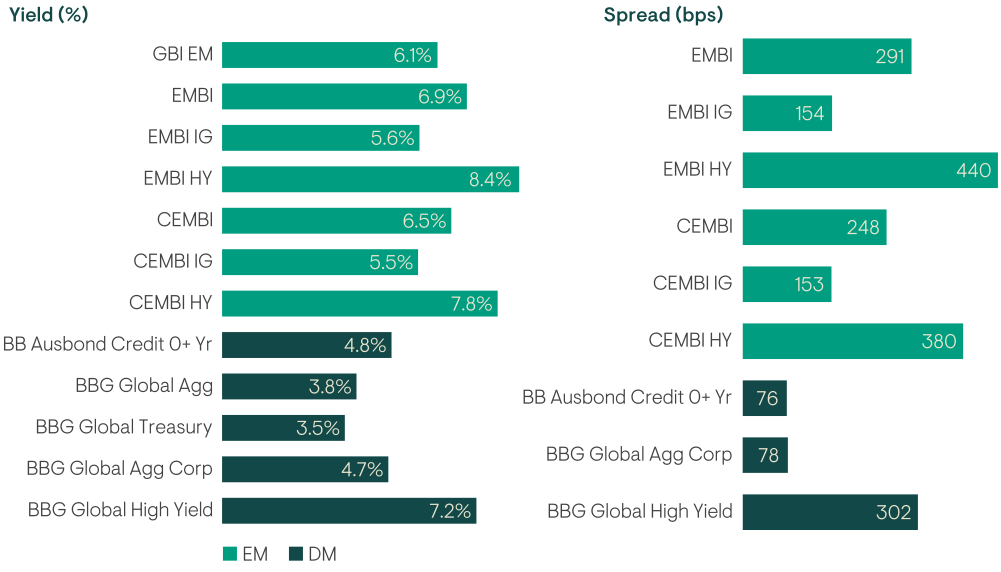
Source: Ninety One, JPMorgan. as at end of June 2026. For further information on indices, please see the important information section.
Flexible portfolio building blocks
EM debt is a diverse asset class spanning different currencies, issuer types and credit ratings, with at least 80 countries accessible to investors, as well as around 700 corporate issuers. This diversity makes the asset class a highly flexible building block for investment portfolios.
Each part of the EM debt asset class has something distinct to offer investors, as each is driven by specific economic forces. This means the asset class can provide diversification in a variety of ways – from local currency markets giving exposure to different yield sources, to dollar-denominated markets providing an alternative growth fixed-income allocation that offers a yield pickup for similar credit quality to developed market debt.
Investors who opt for a single, blended portfolio can seek to better navigate the full EM cycle – benefiting from the divergent dynamics across the asset class while also capturing bottom-up selection opportunities across and within markets.
| Asset class | Drivers |
| Local currency bonds (FX hedged) | Rate market moves: inflation, monetary policy, fiscal policy |
| EMFX | Balance of payments, growth, monetary policy, interest rate differentials |
| Hard currency bonds | Credit spread moves: growth, external balances, balance of payments, fiscal policy |
Source: Ninety One.
A framework for accessing the opportunity set
Many superannuation schemes are already familiar with the benefits of the asset class. But the approach to allocating to this off-benchmark asset class can seem like a conundrum. It doesn't need to. In this section we share three different approaches that investors can take when accessing EM debt.
1. Carve-out approach
One route into an EM debt allocation involves carving out the YFYS-prescribed Global Aggregate (Global Agg) index's EM exposure into its underlying asset classes, to ensure access to the full EM debt opportunity set and allow for customisation of a portfolio's growth fixed income exposure. While this approach introduces tracking error under YFYS regulation, this can be managed by sizing the EM debt allocation closer to benchmark weight.
For context, the Global Agg has a relatively sizable exposure of c.20% to EM debt (as at June 2026). However, this does not fully represent the breadth and diversification of EM issuers. First, the Global Agg only includes investment-grade debt. In contrast, while also a large portion of investment grade exposure, the flagship JPMorgan EM debt indices span the credit-rating spectrum, providing greater opportunities for diversification and yield enhancement. Second, the Global Agg is constructed based on the market capitalisation of the constituent bonds, resulting in a skew to the most indebted issuers. In contrast, JPMorgan's EM debt indices tend to cap exposure to countries to reduce concentration risk, providing more diversified exposure to the EM debt opportunity set.
To illustrate the impact of different index construction approaches, we compare the EM portion of the Global Agg with JPMorgan's Emerging Market Hard-Currency/Local Currency 50-50 index, which we believe is most representative of the broad EM debt universe and is also comparable with the Global Agg.1
Notably, the EM portion of the Global Agg is heavily overweight Asia – China accounts for almost two thirds of the index, with Asia as a whole accounting for 83%. Meanwhile, our comparison JPMorgan index has less than 8% exposure to China, and only 35% exposure to Asia. The Global Agg is also underweight other EM regions, particularly Latin America, Africa and the Middle East, which have very different return drivers to Asia and could offer significant diversification benefits.
EM exposure in the Global Agg: investment grade only, skewed to Asia and limited EM corporate exposure
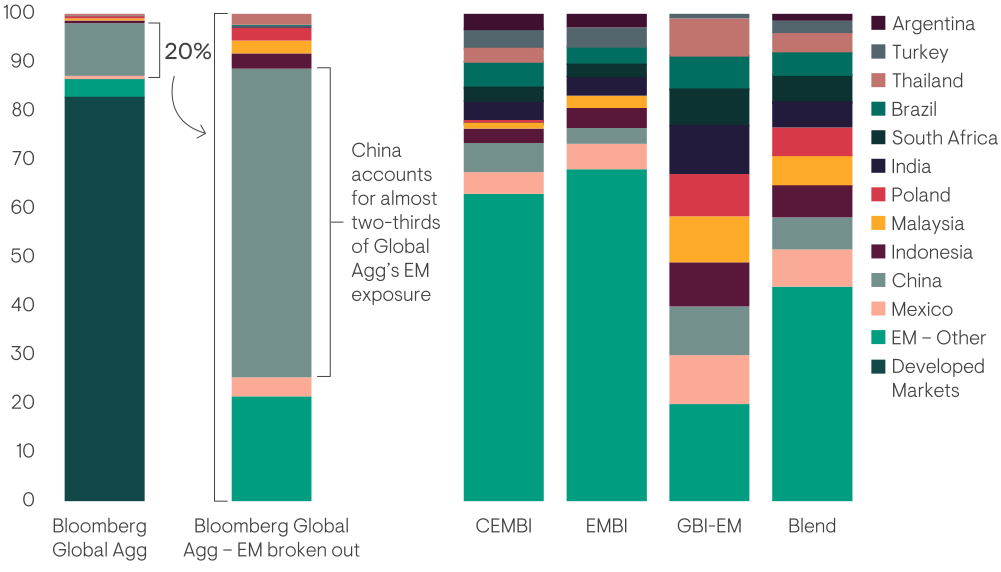
Source: Bloomberg, JPMorgan, Ninety One Calculations, 30 June 2026. EMD Blend is 50% GBI-EM AUD UH ex Russia, 25% EMBI AUD H, 25% CEMBI AUD H. Rolling 1-year ex-post tracking error.
As a next step, we reconstructed the Global Agg with a 20% EM allocation, comprising 50% GBI-EM AUD UH (ex-Russia), 25% EMBI AUD H, 25% CEMBI AUD H. Comparing the resultant portfolio with the 'original' Global Agg, we found:
- The EM component of the Global Agg produces inferior yield per unit of volatility relative to a Blended EM debt approach, reflecting its large weighting towards the low-yielding China local currency debt.
- The reconstructed Global Agg outperforms the 'original' index over both 3 and 5 years – by 0.34% and 0.13% respectively, rising to 0.36% and 0.28% when Russia is excluded – with only a marginal uplift in tracking error (see below).
Excess returns vs the Global Agg
| 3 Year | 5 Year | |
| Reconstructed Global Agg | +0.34% | +0.13% |
| Reconstructed Global Agg ex Russia | +0.36% | +0.28% |
Improved tracking error and excess returns
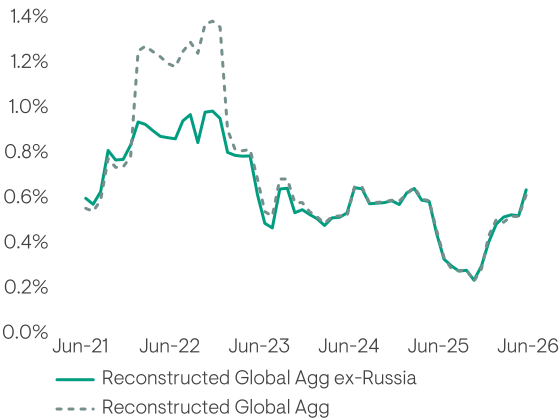
Source: Bloomberg, JPMorgan, Ninety One Calculations, 30 June 2026. EMD Blend is 50% GBI-EM AUD UH ex Russia, 25% EMBI AUD H, 25% CEMBI AUD H. Rolling 1-year ex-post tracking error.
EM debt lifts yield per unit of volatility
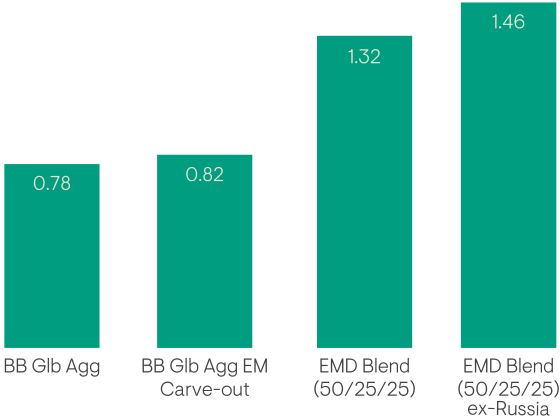
Source: Bloomberg, JPMorgan, Ninety One Calculations, 30 June 2026. EMD Blend = 50% GBI-EM AUD UH ex Russia, 25% EMBI AUD H, 25% CEMBI AUD H. Rolling 1-year ex-post tracking error.
2. Alternative credit allocation
Because EM debt is an effective complement to a developed market credit allocation, it can also be accessed as either a replacement or alongside existing credit exposures.
Under the YFYS framework, many funds benchmark their international credit exposure to the Bloomberg Global Aggregate Corporate Index (hedged to Australian dollars). As this index mainly consists of developed market investment grade debt, asset allocators often add off-benchmark exposures such as global high yield or leveraged loans for additional return and diversification benefits. As a spread asset class, hard currency sovereign and corporate EM debt can be accessed in exactly the same way, alongside or in place of these exposures. In addition, the unique advantages of the Australian dollar (noted earlier) provide a strong case for including local currency debt as part of an EM debt allocation.
The most powerful argument for pairing EM debt with an existing credit allocation, however, is diversification. The correlation profile over the five years to June 2026 illustrates this clearly. As shown below, a blended EM debt allocation has a correlation of just 0.68 to global investment grade, 0.64 to global high yield, and 0.47 to global leveraged loans.2 The diversification is strongest in the unhedged EM local currency sleeve, with a correlation of only 0.20 to global investment grade and below 0.10 to both global high yield and global leveraged loans – creating space for a genuinely differentiated return stream.
EMD offers meaningful diversification against global credit
| YFYS Credit Benchmarks | Alternative Credit Solutions | US Treasuries H AUD |
|||||
|---|---|---|---|---|---|---|---|
| 5 years to June 2026 | BB Glb Agg H AUD | BB Glb Treasury H AUD | BB Glb Agg Corp H AUD | BB Ausbond Comp | BB Global HY Corp H AUD | Morningstar Global LL | |
| GBI-EM UH AUD | 0.25 | 0.27 | 0.20 | 0.41 | 0.09 | 0.06 | 0.23 |
| EMBI H AUD | 0.70 | 0.55 | 0.87 | 0.43 | 0.89 | 0.71 | 0.41 |
| EMBI IG H AUD | 0.86 | 0.75 | 0.93 | 0.61 | 0.76 | 0.58 | 0.67 |
| EMBI HY H AUD | 0.50 | 0.34 | 0.73 | 0.25 | 0.88 | 0.76 | 0.16 |
| CEMBI H AUD | 0.63 | 0.46 | 0.84 | 0.38 | 0.88 | 0.66 | 0.32 |
| CEMBI IG H AUD | 0.78 | 0.64 | 0.92 | 0.52 | 0.81 | 0.57 | 0.53 |
| CEMBI HY H AUD | 0.44 | 0.26 | 0.72 | 0.21 | 0.88 | 0.72 | 0.10 |
| EMD Blend* | 0.58 | 0.49 | 0.68 | 0.48 | 0.64 | 0.47 | 0.32 |
Source: Bloomberg, JPMorgan, Ninety One calculations, five years to 30 June 2026. *EMD Blend = 50% JPMorgan GBI-EM Global Diversified (unhedged AUD) / 25% JPMorgan EMBI Global Diversified (hedged AUD) / 25% JPMorgan CEMBI Broad Diversified (hedged AUD). Correlations and portfolio statistics based on monthly returns. For illustrative purposes only; past performance is not a reliable indicator of future results.
Over the five years to June 2026, adding blended EM debt to an existing global high-yield allocation at a 50/50 weighting would have lowered volatility while leaving returns broadly unchanged. For a benchmark-aware investor, it would also have reduced the maximum monthly drawdown, lowered tracking error to the Bloomberg Global Aggregate Corporate Index (AUD hedged) index, and increased the information ratio - all while cutting high-yield exposure from 100% to 67% of the sleeve. This highlights the positive diversification benefits of EM debt in practical terms.
Blending in EM debt with alternative credit solutions would have lowered risk without giving up excess return
| 5 years to June 2026 | Bloomberg Global Agg (H AUD) | Bloomberg Global Agg - High Yield (H AUD) | EMD Blend | 50/50 Global Agg - High Yield / EMD Blend |
| Return | 0.00% | 3.00% | 2.80% | 2.90% |
| Vol | 6.50% | 6.40% | 5.90% | 5.50% |
| Risk Adjusted Return | 0 | 0.47 | 0.47 | 0.53 |
| Max Monthly Drawdown | -4.90% | -6.90% | -6.60% | -4.80% |
| Excess Return* | - | 3.00% | 2.70% | 2.90% |
| Tracking Error* | - | 2.20% | 3.10% | 2.10% |
| Information Ratio* | - | 1.37 | 0.87 | 1.41 |
| High Yield Exposure | 0% | 100% | 33% | 67% |
Past performance does not predict future returns; losses may be made.
Source: Bloomberg, JPMorgan, Ninety One Calculations, 30 June 2026. *vs. Bloomberg Barclays Global Aggregate Corporate AUD H. EMD Blend = 50% JPMorgan GBI-EM Global Diversified (unhedged AUD) / 25% JPMorgan EMBI Global Diversified (hedged AUD) / 25% JPMorgan CEMBI Broad Diversified (hedged AUD).
3. Alternatives exposure
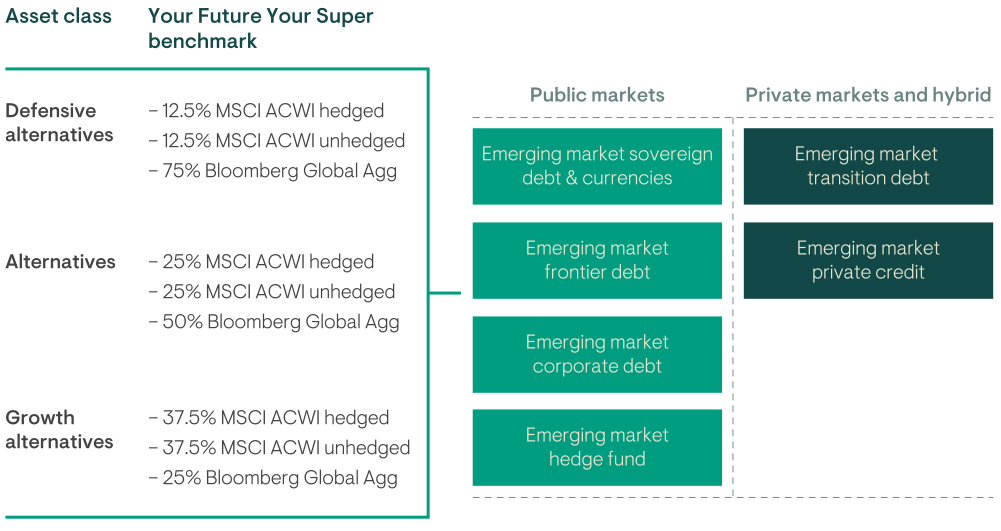
EM debt can also play a role within a superannuation scheme's alternatives allocation. In this context, a blended EM debt sleeve can enhance the income and total return of the alternatives bucket while retaining genuine diversification. Furthermore, the EM opportunity set extends well beyond public markets.
EM debt as an asset class spans the full liquidity and risk spectrum – from the most liquid, a blended EM debt strategy, through to the least liquid, EM private credit. Within this broad spectrum, the best fit for each investor is a function of their liquidity needs and risk appetite. Selecting the right approach requires a disciplined framework that reflects experience investing across EM sovereign and corporate debt, in both local and hard currency, and in managing asset allocation across the spectrum while controlling for risk.
Where EM debt fits within the YFYS alternatives benchmark
In summary
Emerging market debt has evolved into a more mature and resilient asset class. It also continues to offer a yield and spread advantage over comparable developed market credit, and for Australian investors, the Australian dollar's historical correlation with EM currencies provides a structural (albeit not guaranteed) advantage when accessing local currency debt unhedged.
Beyond these return and currency benefits, the asset class offers genuine diversification, with a blended EM debt allocation showing consistently low correlation to comparable developed market credit exposures – an advantage that strengthens further in the unhedged local currency sleeve.
We believe the case for Australian superannuation schemes to allocate to this off-benchmark asset class is increasingly well evidenced, and the routes available to do so are broad enough to suit most funds' liquidity needs and risk appetite.
1. To make the comparison clearer, we have scaled up the EM portion of the Global Agg to 100%.
2. Blended EM debt allocation = 50% JPMorgan GBI-EM Global Diversified (unhedged AUD) / 25% JPMorgan EMBI Global Diversified (hedged AUD) / 25% JPMorgan CEMBI Broad Diversified (hedged AUD); global investment grade = Bloomberg Global Aggregate Corporate Index (hedged AUD); global high yield = Bloomberg Global High Yield Corporate Index (hedged AUD); global leveraged loans = Morningstar Global Leveraged Loan Index.
General risks. The value of investments, and any income generated from them, can fall as well as rise. Where charges are taken from capital, this may constrain future growth. Past performance is not a reliable indicator of future results. If any currency differs from the investor's home currency, returns may increase or decrease as a result of currency fluctuations. Investment objectives and performance targets are subject to change and may not necessarily be achieved, losses may be made. Environmental, social or governance related risk events or factors, if they occur, could cause a negative impact on the value of investments.
Specific risks. Geographic/Sector: Investments may be primarily concentrated in specific countries, geographical regions and/or industry sectors. Currency exchange: Changes in the relative values of different currencies may adversely affect the value of investments and any related income. Default: There is a risk that the issuers of fixed income investments (e.g. bonds) may not be able to meet interest payments nor repay the money they have borrowed. The worse the credit quality of the issuer, the greater the risk of default and therefore investment loss. Emerging market: These markets carry a higher risk of financial loss than more developed markets as they may have less developed legal, political, economic or other systems.
