Vinfast produces electric cars and scooters from its Vietnam facility. Vinfast endeavours to be the top producer of lower-cost electric vehicles by giving customers the ability to buy a car but rent the battery (the most expensive component in the vehicle) thereby bringing down the average selling price. Most if not all science-based pathways for decarbonizing the global mobility sector involve the phase-out of internal combustion engines- giving consumers lower-cost options can better facilitate EV penetration. Vinfast has ambitious plans to grow operations globally which our capital can facilitate.
United Kingdom
Select your role
Sustainable investing
A disorderly transition
Evidence suggests the transition to a low-carbon economy will be disorderly. By allocating to ‘transition assets’, investors can mitigate some of the disorder, while potentially generating positive outcomes for their portfolios. This paper makes the case for transition investing, and explains how to identify a true ‘transition asset’.
7 Mar 2023
25 minutes
Chapters
01
Fast view02
A matter of how disorderly03
Are asset owners embracing transition investments?04
Developing a transition framework05
Transition investments for asset owners06
The impact of transition finance on portfolios07
Actionable steps08
Breakdown of climate strategies01
Fast view

A transition to net zero is unlikely to be neat or methodological. Industries will not find low-emission technology that steadily reduces global emissions by 7.6% each year; a pace of reduction which would halve emissions by 2030. As timelines lag there is likely to be a scramble to catch-up.
We already see signs of shifting supply and demand patterns creating volatility, not to mention protectionism, in markets. Evidence suggests we are at the start of a disorderly transition. Next to the actions of policy makers, how disorderly the transition becomes will be influenced by asset owners, investors, and companies’ own emission reduction plans.
The transition requires huge investment in new green infrastructure. But reaching net zero depends on more than this. High emitters in traditional ‘smoke-stack’ industries require funding to spur their transition to a low-carbon world. Just how much funding and the conditions upon which it is received becomes the crucial question. There are five economically important, high-emitting sectors where successful transitions will generate powerful change. These are power, buildings, mobility, industry and agriculture which together generate more than 90% of global emissions. Each of these sectors is capital intensive with substantial fixed assets and long-standing business models. Change will not be quick or easy.
Transition investments or transition finance is the burgeoning investment category that will support high-emitters in their efforts to reduce emissions. This is distinct from climate solution providers which offer the products and services that drive decarbonisation.
This is not a free pass for investors to own high-emitting sectors. Instead, responsible investors must distinguish between companies that have a credible transition plan and those that can’t or will not change sufficiently. Investors need the assurance that these ‘transition investments’ have the capacity to reduce emissions in the long run. To do this, the most appropriate course of action is to adopt a categorisation framework that consistently identifies which assets qualify as transition investments.
The Sustainable Markets Initiative have launched an approach to do this. Its framework places transition assets into one of five categories which allows investors to identify companies that may qualify as Paris-aligned transition candidates. Such a framework can underpin the required growth in transition finance.
The low-carbon transition will have marked macroeconomic effects – notably the potential for higher inflation. One of the benefits to asset owners therefore is that investment in the transition leaders across high-emitting sectors could provide some inflation protection and solid returns as the leading names attract capital at the cost of the laggards.
For transition investing to work, both carbon impact and commercial returns are essential. Rather than disinvesting from heavy emitters we can mitigate carbon emissions by supporting those companies with robust transition plans.
This paper argues that growth in transition investments and transition-related targets will help mitigate disorder, in the process improving our chances of a lasting transition to net zero.
A disorderly transition
Fast view
A transition to net zero is unlikely to be neat or methodological. Industries will not find low-emission technology that steadily reduces global emissions by 7.6% each year; a pace of reduction which would halve emissions by 2030. As timelines lag there is likely to be a scramble to catch-up.
We already see signs of shifting supply and demand patterns creating volatility, not to mention protectionism, in markets. Evidence suggests we are at the start of a disorderly transition. Next to the actions of policy makers, how disorderly the transition becomes will be influenced by asset owners, investors, and companies’ own emission reduction plans.
The transition requires huge investment in new green infrastructure. But reaching net zero depends on more than this. High emitters in traditional ‘smoke-stack’ industries require funding to spur their transition to a low-carbon world. Just how much funding and the conditions upon which it is received becomes the crucial question. There are five economically important, high-emitting sectors where successful transitions will generate powerful change. These are power, buildings, mobility, industry and agriculture which together generate more than 90% of global emissions. Each of these sectors is capital intensive with substantial fixed assets and long-standing business models. Change will not be quick or easy.
Transition investments or transition finance is the burgeoning investment category that will support high-emitters in their efforts to reduce emissions. This is distinct from climate solution providers which offer the products and services that drive decarbonisation.
This is not a free pass for investors to own high-emitting sectors. Instead, responsible investors must distinguish between companies that have a credible transition plan and those that can’t or will not change sufficiently. Investors need the assurance that these ‘transition investments’ have the capacity to reduce emissions in the long run. To do this, the most appropriate course of action is to adopt a categorisation framework that consistently identifies which assets qualify as transition investments.
The Sustainable Markets Initiative have launched an approach to do this. Its framework places transition assets into one of five categories which allows investors to identify companies that may qualify as Paris-aligned transition candidates. Such a framework can underpin the required growth in transition finance.
The low-carbon transition will have marked macroeconomic effects – notably the potential for higher inflation. One of the benefits to asset owners therefore is that investment in the transition leaders across high-emitting sectors could provide some inflation protection and solid returns as the leading names attract capital at the cost of the laggards.
For transition investing to work, both carbon impact and commercial returns are essential. Rather than disinvesting from heavy emitters we can mitigate carbon emissions by supporting those companies with robust transition plans.
This paper argues that growth in transition investments and transition-related targets will help mitigate disorder, in the process improving our chances of a lasting transition to net zero.
A matter of how disorderly
Transitioning the global economy to net zero emissions will not be painless.
We have already seen prices react in specific industries. However, the continued slow pace of emissions reduction raises the risk of a late and disorderly transition. According to consultants Verisk, the eventual transition could well feature emissions limits imposed on factories with little warning, forced purchases of clean energy and massive levies on carbon. However, disorder is a spectrum. And for investors, the level of disorder matters, because it could have a major bearing on investment outcomes in the decades ahead.
The Network for Greening the Financial System (NGFS), an organisation which convenes the world’s central banks, proposes six transition scenarios1. They present different levels of transition risk linked to policy shifts and changing consumer preferences, and of physical risk including losses from climate events. The scenarios are grouped into quadrants: ‘Disorderly’, ‘Orderly’, ‘Hot house world’ and ‘Too little, too late’. Current climate policies put us in the ‘Hot house world’.
The two scenarios in the ‘Disorderly’ quadrant are eye-catching. They are also plausible. In the first, ‘Divergent Net Zero’, net zero is reached by 2050 but with higher costs due to disjointed policies introduced across sectors and a quicker phase-out of fossil fuels. In the second, ‘Delayed Transition’, global emissions do not decrease before 2030, fossil fuels prove difficult to displace, and far-reaching policies are implemented to limit global emissions. This leads to higher physical and transition risks (Figure 1).
Figure 1: NGFS scenario mapping

Source: NGFS scenario portal.
We are already seeing manifestations of disorder in several industries, not least the energy sector. Public oil & gas companies have reduced capital expenditure dramatically since the 2014 oil-price peak and the 2015 Paris Climate Agreement, as they no longer have a clear mandate from shareholders to increase production of fossil fuels. In 2022, this underinvestment collided with the interruptions to supplies of Russian oil & gas, leading to elevated prices of gas, oil, coal and electricity. But even absent conflict in Europe, we are likely to experience disorderly energy prices until the industry achieves a better equilibrium between supply, demand and investment.
In the real estate sector, houses in some US coastal areas sell at a 5-10% discount to those in less climate-impacted regions.2 This makes sense: insuring these properties has become much more expensive with climate risk being built into insurance models. But suppose we reach a higher level of disorder, in which insurers pull out of these regions. Many seaside properties would become all but worthless. If coastal flooding worsens and sea levels keep rising, such a scenario is quite possible.
The cement industry, which contributes about 8%3 of global emissions, also stands at a juncture from which different pathways proceed. Viable alternatives to cement are limited. It is also a critical input into the build-out of renewable energy. Along with steelmaking, cement is high on the list of essential but hard-to-decarbonise sectors. In February 2022, CEMEX, the leading cement manufacturer in Mexico, successfully piloted the production of green clinker, the key binding ingredient in cement, using solar energy. But developing solar-driven plants at scale will require huge investment. At the same time, the transition from old to new technology must be managed so that cement demand can continue to be met. If this does not happen, cement prices – and hence global construction costs – could rise sharply. Figure 2 depicts a stylised idea of how an orderly and disorderly transition pathway might look for the cement industry.
Figure 2: Comparing an orderly and disorderly scenario for the cement industry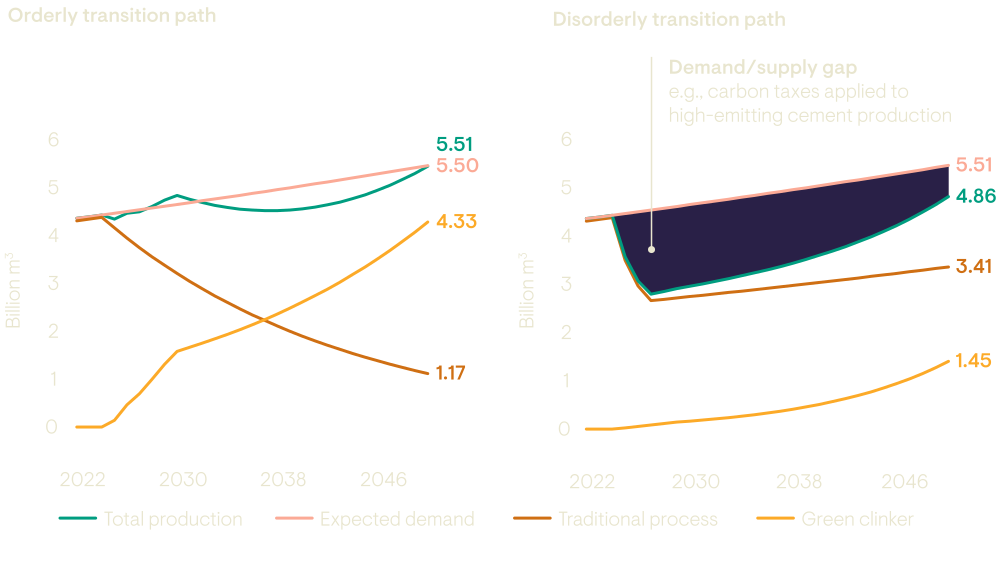
Source: Ninety One. Created for illustrative purposes only.
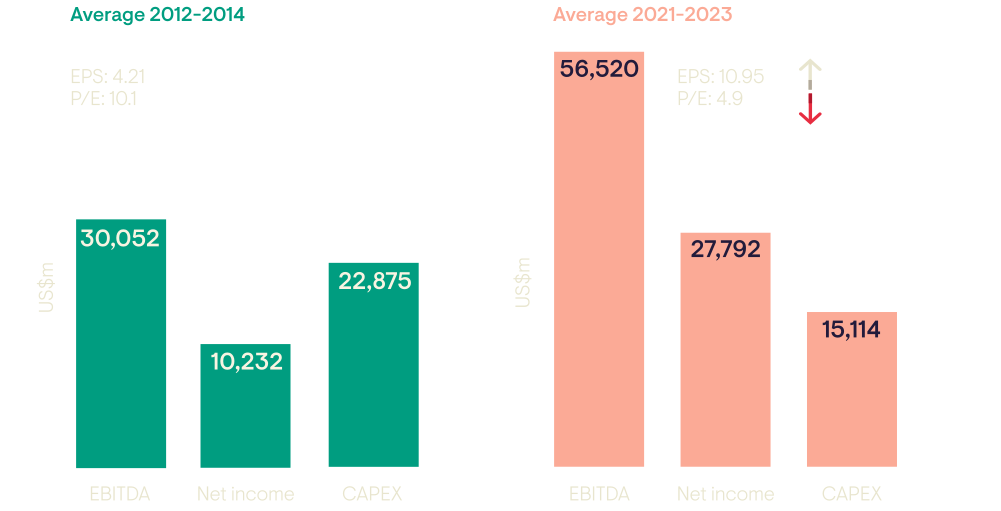
For investors, disorderly transitions will translate into volatile market valuations and may lead to mispricing or deratings. To illustrate what could happen, we use the derating experienced by the energy sector. Figure 3 shows the earnings, net income and capital expenditure of TotalEnergies, the French multinational energy company, covering two periods – 2012-2014 and 2021-2023. Both periods are punctuated by high average oil prices, but while earnings-per-share more than doubled during 2021-2023, the company’s PE ratio halved to less than 5 times. To some extent, the low earnings multiple highlights a lack of willingness to own oil and gas companies.
Figure 3: TotalEnergies — sector derating
Source: Bloomberg, 31 December 2022.
Despite a marked improvement in TotalEnergies’ more recent financial performance – a doubling of cashflow and a trebling of earnings – the stock price at the time of writing is roughly where it was in 2014.
Of course, multiple factors have contributed to the derating, including concern over peak earnings and a potential decline in commodity demand due to slower global growth. But we are also seeing the market repricing TotalEnergies as investors decarbonise their portfolios by excluding high-emitting sectors. Will a more effective approach be to analyse the transition potential of high-emitting areas of the global economy and direct return-seeking capital to where real-world carbon reduction can be achieved?
A transition lens on the big five emitters
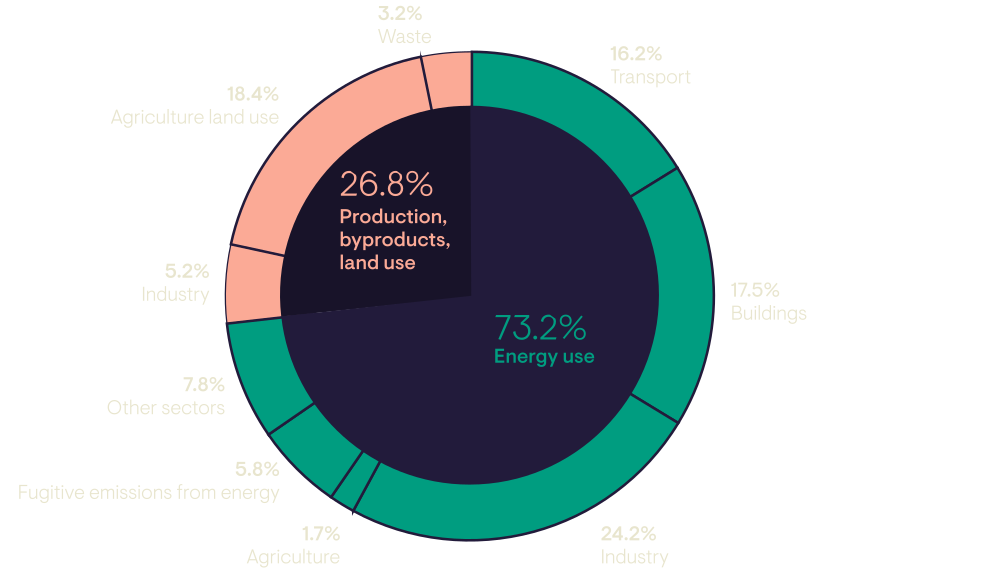
More than 90% of the world’s total emissions are generated from five areas of economic activity: power, buildings, mobility, industry and agriculture. They are sectors central to global growth, which means any disruptions to their output have a significant impact on the economy.
Figure 4: Breakdown of emissions by sector
Source: Our world in data (2019). Please note that this diagram has been redrawn by Ninety One.
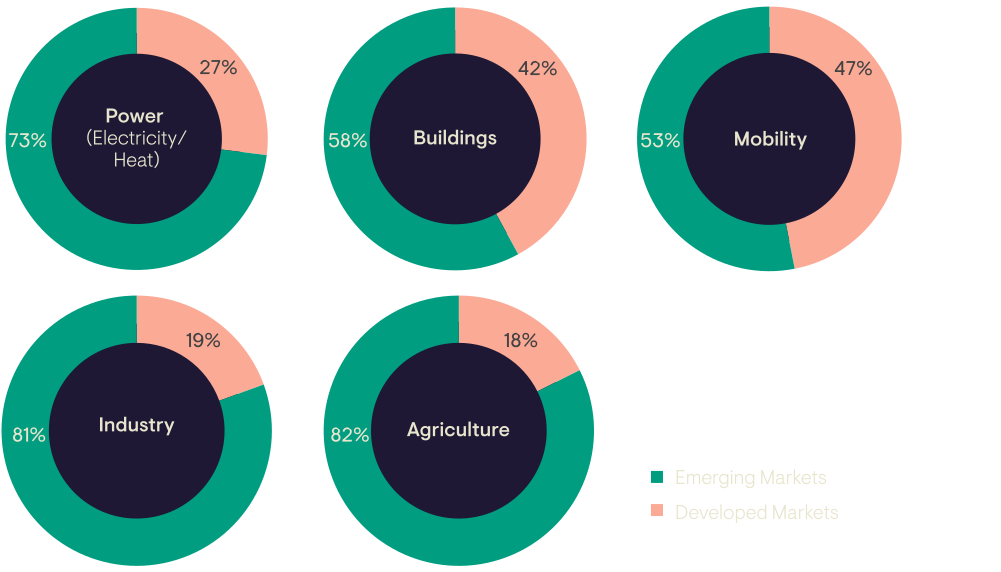
Estimates show that over US$30 trillion would need to be invested in these activities to drive their transition between now and 2030. A healthy portion of this funding will need to be allocated to emerging markets, where we expect 90% of emissions growth over the next decade. Figure 5 provides a production based breakdown of emissions by sector which emphasizes the extent in emerging markets. If this chart were to be based on where products are consumed then the picture would change.
Figure 5: Breakdown of emissions by region across high-emitting sectors
Source: Climate Watch. Data extracted in January 2023. Based on 2019 emissions estimates.
For investors these sectors share a set of common characteristics:
Decarbonisation takes time
It is important to recognise that these companies are capital intensive with fixed assets and established business models that will need time to evolve. In most cases, new technologies will be required to help companies decarbonise. In certain regions, pronounced social issues such as employment and workers’ rights currently take precedence over environmental considerations. Regardless, these are companies and industries that cannot change overnight.
There is no ‘one size fits all’ solution for these sectors
Corporate environmental strategies have diverged substantially due to a range of factors, such as uncertainty around technologies, timescales and structural changes. Even within a smaller sub-set, such as utilities, companies are setting very different courses towards net zero, with some companies far more aggressive in their pursuit of renewable energy strategies.
Fertile ground for active managers
A more orderly transition will rely on a coherent transition assessment framework that helps identify and support success stories, and where appropriate, set aside problem cases. This is fertile ground for active managers seeking performance from companies who are facilitating the transition rather than perpetuating the problem, and where the market does not fully understand or price-in the transition potential.
1 NGFS Scenarios Portal.
2 Bernstein, Gustafson, Lewis. Disaster on the horizon: The price effect of sea level rise.
3 Global Carbon Project.
Are asset owners embracing transition investments?
To date, asset owners have adopted a variety of investment approaches to prepare for the carbon transition (Figure 6).
Broadly, many have sought to mitigate climate risk by tilting allocations towards low-emitting companies and sectors. Given that more than 90% of global emissions are concentrated in five sectors – power, buildings, mobility, industry and agriculture – this is straightforward to implement at the portfolio level. But it also reduces exposure to some of the companies most likely to benefit from the carbon transition, and it does nothing to reduce emissions in the global economy.
More asset owners are now allocating to green infrastructure and green bonds – debt instruments whose proceeds are directed at environmentally responsible projects – and the equities of climate-solutions providers. The latter are companies that offer products and services that will drive decarbonisation. We expect them to enjoy a tailwind of structural growth – helped by tightening regulation, technological advances and changing consumer preferences – for the next decades. This has the potential to generate portfolio returns, as well as providing finance to businesses that are driving real-world decarbonisation.
However, each of these investment approaches are likely to exclude, or at least limit exposure to, many of the highest-emitting companies in the highest-emitting sectors. These are the businesses that must transition successfully if we are to have any hope of reaching net zero. These ‘transition investments’ are also, in our view, some of the assets with the most potential to profit from the shift to a low-carbon economy.
They are also the investments highlighted in Figure 6 that have so far received the least attention. According to Ninety One’s Planetary Pulse survey 2022, only 19% of asset owners said they use transition finance to any extent and 16% invest in transition-finance assets in emerging markets. Asked whether transition finance will grow quickly, 60% expect transition finance to grow rapidly over the next three years.
Figure 6: How a range of climate-aligned strategies impact real-world change
| Climate-aligned strategies | Reduces portfolio-level carbon footprint | Leveraged to decarbonisation trend | Invests and engages in high-emitting sectors | Influences real-world decarbonisation |
|---|---|---|---|---|
| Green infrastructure (via private markets) | ||||
| Green bonds | ||||
| Low-carbon screen or index equities | ||||
| Climate solutions | ||||
| Transition Investments |
Source: Ninety One.
The biggest positive impact on real-world emissions is to either support the growth of new technologies that results in the displacement of carbon intensive products (e.g., renewable energy or electric vehicles) or to fund the decarbonisation investment of high-emitting entities with excellent transition plans. While climate solutions have gained much attention, particularly in developing markets, the latter has been neglected. The need to install a transition focus when setting climate goals is increasingly prevalent for asset owners. The key is to do this in a manner that is credible and avoids greenwashing. A vast majority of the required investment to drive a low-carbon economy will be to transition emissions-intensive industries. With clear frameworks that support credible transition investments, the barriers are diminishing. This is not a free pass to own high emitters, it is about identifying and driving transition potential.
Transition finance
Transition finance can take multiple forms. It can be private and public financing for corporates across both equity and debt. It can include project finance, but crucially a transition finance investment meets the following criteria:
- It has been categorised (as per the transition framework set out in the next section)
- It has a measurable impact on emissions either by:
- carbon avoidance (emissions avoided by using a product that has less carbon emissions than the status quo) or
- carbon reduction (investments with companies that are significantly reducing GHG emissions with a credible trajectory to net zero)
- There is a credible transition plan for the investment that is Paris-aligned
- An objective assessment of the asset’s transition plan is conducted
- Strategic engagement plans have been established, where needed
The following section outlines these elements in detail to examine how investors can identify credible transition investments.
Developing a transition framework
Up until recently, there was no framework for investors to identify what is and what is not a ‘transition investment’.
Bridging the shades of ‘brown’ to ‘green’ requires a logic framework. Over the last 12 months, many publications aimed to address this, albeit from different angles. Examples include the Net-Zero Investment Framework developed by the IIGCC4, GFANZ’s Financial Institutions Net-Zero Transition Plan paper5, and Investor Leadership Network’s playbook on Transition Finance Best Practice6.
However, none of these provided guidance for asset owners or asset managers on how to allocate capital credibly to high-emitting regions or sectors, while minimising the risk of ‘greenwashing’.
To tackle this, the asset managers and asset owners task force (under the Sustainable Markets Initiative umbrella7) established a Transition Finance working group in 2022 to provide guidance on how transition investments can be categorised.
The Sustainable Markets Initiative transition categorisation
This working group, which included Ninety One, developed a methodology that defines transition assets across five categories. Now referred to as the SMI ‘Transition Categorisation’ framework, published in January 2023, the approach helps investors identify companies that are on a credible pathway to net zero. In practice, the approach is as follows:
01 The starting point
Start where the carbon is: If an investment sits in one of the five high-emitting economic areas (power, buildings, mobility, industry and agriculture), it is likely to require rapid and significant levels of decarbonisation. However, for a company to be considered a transition investment with integrity, it will need to contribute significantly to decarbonisation. This can take two forms – either carbon reduction, which requires the company to have a credible transition plan in place, or carbon avoidance if its product or service displaces a traditional but unsustainable one. A credible plan is one with a Paris-aligned pathway that is achieved by 2050 or sooner. For reference, Paris-alignment means having an emissions reduction pathway that is consistent with keeping a global temperature rise well below 2°C above pre-industrial levels, while pursuing a ceiling of 1.5°C warming.
02 Defining the categories
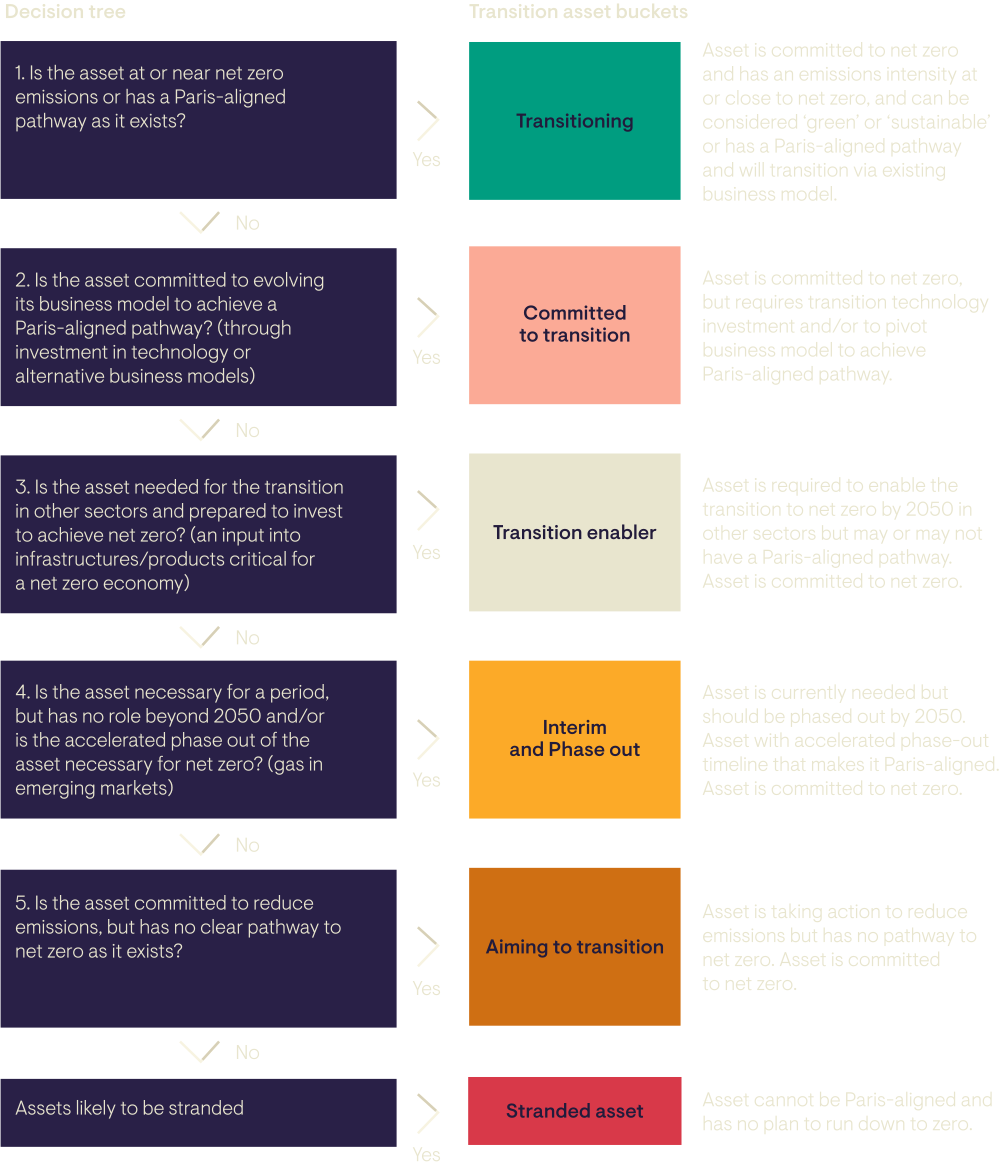
There are five transition categories that best capture the characteristics of companies or assets within the high-emitting sectors and that are on a path to sustainability. Figure 7 lays out the process in the form of a decision tree that when followed can help identify if a company or asset is a transition investment. If the investment does not qualify for one of the five categories, it is likely to be stranded. A stranded asset is one that is not aligned with the sustainability requirements laid out in the Paris Agreement, and that has no clear pathway to achieving net zero.
Figure 7: SMI transition categorisation 'decision tree'
Source: Sustainable Markets Initiative
03 Assessing transition plans
The minimum standards for a company to qualify as a transition investment include having a commitment to decarbonisation, either via a public net-zero commitment or otherwise stated, and a credible transition plan to accompany that commitment.
For a company in a high-emitting sector, a transition plan demonstrates to an investor how the company aims to achieve its net-zero target, and the cost associated with this transition. There are multiple views on how to assess a credible transition plan, with many investors developing their own in-house transition framework. Figure 8 provides a high level view on how Ninety One have approached this assessment.
Figure 8: Ninety One’s Transition Plan Assessment framework
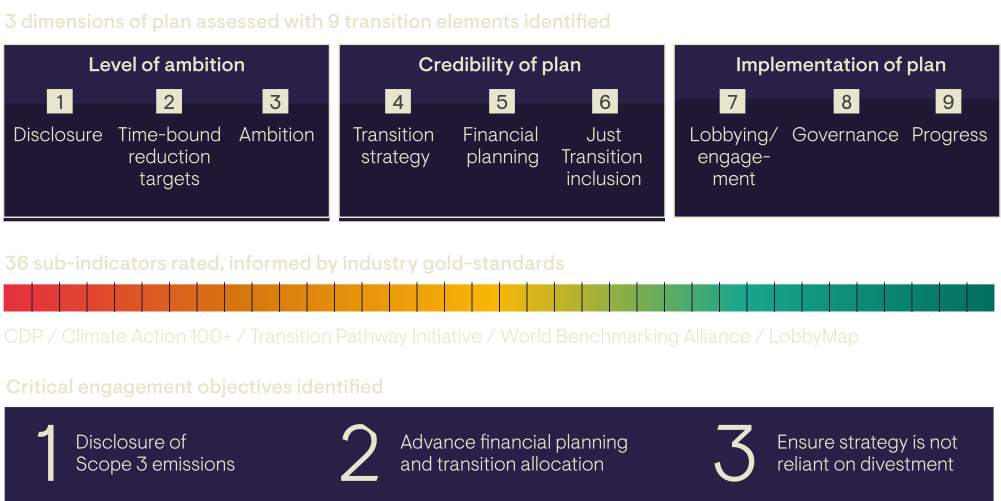
The framework enables us to assess where companies are on their transition journeys today, and have influence on where they will be in the future.
04 Establishing credibility for transition categorisation
A credible transition framework for high-emitting sectors is a necessary step to attract transition finance to these sectors.
Globally, the consensus of ‘what good looks like’ from a sector-level perspective has made a fair bit of progress. However, there is very little consistency in terms of what criteria or thresholds are required to achieve a net-zero transition. These factors are often dynamic and need to be customised for different sectors and regions to accommodate complex transitions and varied starting points.
For example, the requirements for an auto manufacturer to establish a Paris-aligned pathway compared to a cement company are drastically different. Similarly, an emerging-market company versus a developed-market competitor should have different expectations in terms of the pace of their decarbonisation. Clear guardrails around each transition bucket are a vital starting point to help clarify this complexity, while preserving credibility of the transition framework.
Figure 9 sets out SMI’s categorisation of transition assets in five distinct buckets. The categorisation approach differentiates between the first four categories (which are aligned with the Paris Agreement) and the fifth category (which recognises companies in sectors that do not have a Paris-aligned pathway, but that serve as key components to the transition process). Categories one, two and four require Paris-aligned pathways. The third category is an exception, as these companies produce materials needed to transition other sectors: these are referred to as ‘Transition enablers’.
Figure 9: Transition categorisation
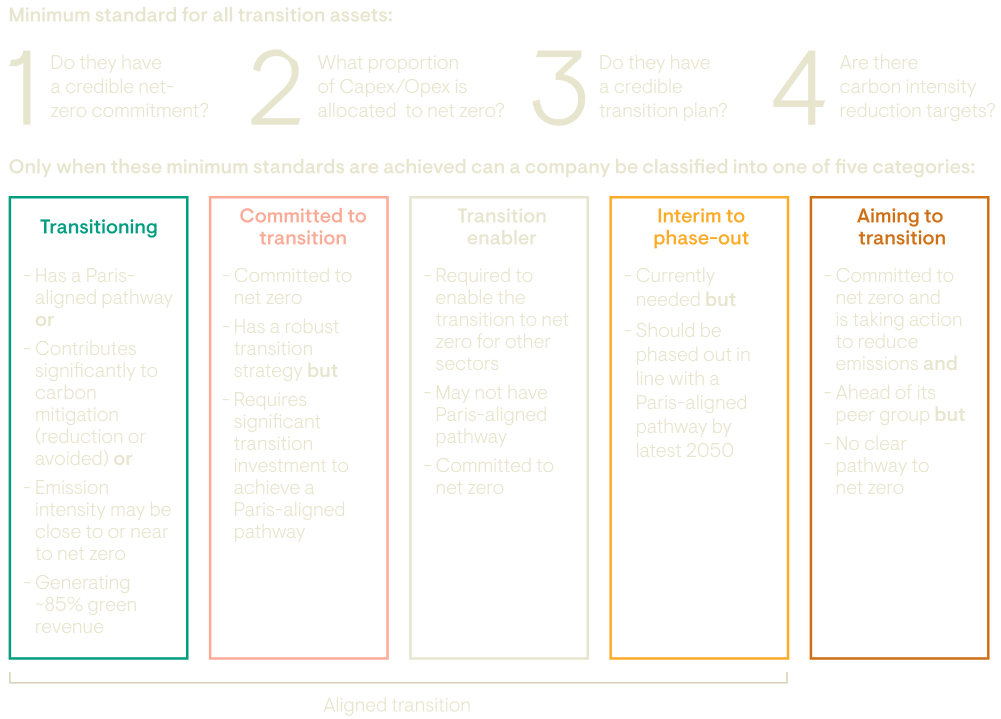
If we stay with the example of ‘Transition enablers’ we then need to set criteria and guidelines that determine which assets qualify. Transition enablers are those with products or materials that are core components in ‘decarbonisation solutions’. A diversified mining company that produces copper or lithium, which is a key input in solar-PV or battery technology, might qualify. If so, it would need to fit the following criteria (which are proposals for illustrative purposes):
- A net-zero commitment (formal or otherwise stated).
- The company’s output or product is required for net-zero solutions, where no commercially viable or low-carbon alternatives exist.
- The company is committed to reducing carbon intensity of production in line with a Paris-aligned pathway for the sector (as assessed by the Transition Pathway Initiative or Science-Based Targets Initiative).
- The capex allocation to the company’s transition will increase to [50]% by [2030].
- More than [30]% of revenue will be generated by a low-carbon or transition product by [2030].
These criteria must be backed by science to build the credibility of the SMI framework. Over time, these guidelines and requirements will evolve and tighten to reflect momentum. This builds trust in the transition-based approach for asset owners and encourages allocation to transition investments where there is tangible potential for real-world decarbonisation. The framework helps define what a transition investment universe includes, and which companies should qualify for ongoing investment, as well as providing a clear reporting mechanism for asset owners to demonstrate accountability for owning carbon-intensive assets.
Alongside the assessment of a company’s transition plan, the categorisation of transition investments and the guidelines for each of the five categories, the final pillar of a transition strategy is engagement. It enables investors to keep up to date on the transition plans and targets of the companies in high-emitting sectors and in some cases to drive change. Regular engagement with management is crucial given the changing nature and dynamism of the targets and plans. The second part is more difficult, and we must be open and honest about the ability to change corporate strategies. At Ninety One, we are focusing our strategic engagements on our highest-emitting companies because this is where it matters most and to give us the highest probability of success.
Figure 10: Categorisation in action
Aligned transition
Transitioning / mitigating
Vinfast
Committed to transition
JSW Energy
Owner and operator of 1.3GW of installed hydro power plants in India, JSW is the largest private hydro power generation company in the country. The company is building another hydro power plant and, at the parent JSW level, is constructing 1GW of hydro capacity for sister company JSW Steel. JSW Energy has committed to having an SBTi approved target and to being carbon-neutral by 2050. The parent plans to reach 16GW in renewable capacity by 2030 which will replace coal in the energy matrix and is part of India’s updated NDC to reach Net Zero by 2070. The transition to renewables at JSW steel is an important lever for reducing emissions in the Indian steel industry as other carbon-reducing industrial process improvements have failed to reach commercial viability.
Transition enabler
CEMEX
CEMEX is the third largest cement producer in the world and the second largest emitter in Mexico. With no viable alternative to cement for infrastructure and construction, greening this hard-to-abate sector is pivotal to reaching net-zero targets. In 2022, the company partnered with Synhelion, a tech company specialising in solar fuels to successfully produce solar-powered clinker – the key ingredient in the cement production process. With emissions reduction targets set for 2025 and 2030, CEMEX have a transition strategy aligned with the Paris Agreement fitting the criteria required to be a tangible transition investment.
Interim to phase-out
RWE
RWE is a German multinational energy company generating and trading electricity in Asia-Pacific, Europe and the United States. The energy mix consists of a balance of natural gas, lignite, hard coal, nuclear and renewables. In 2018, RWE was Europe’s largest carbon dioxide emitter. After facing years of scrutiny, RWE decided to plan for a phase down of hard coal, lignite and nuclear, to be completely phased out by 2023. RWE no longer operates hard coal fired power plants in the UK and Germany. The remaining two plants in the Netherlands are being converted to biomass. While the high carbon business phases down, the company is pivoting toward renewables, investing US$50bn in renewable energy by 2030.
Aiming to transition
bp
bp is one of the largest listed energy companies in the world, employing around 65,000 people in 70 countries worldwide. It has existed for over 100 years and has historically focussed almost exclusively on oil and natural gas. While the company does not have a plan to be net zero by 2050, bp has set out an ambitious strategy to transition into a fully diversified energy company: by 2030, bp is aiming to allocate 50% of its annual capital expenditure to its five transition growth areas (bioenergy, electric vehicle charging, renewable energy, hydrogen and convenience), and to reduce its oil & gas production by 40%.
4 IIGCC. Net Zero Investment Framework Implementation Guide.
5 GFANZ. Financial Institution Net-zero Transition Plans.
6 The Net Zero Investor Playbook.
7 Sustainable Market Initiative. Transition Categorisation Framework.
Transition investments for asset owners
Public companies account for a vast majority of the world’s emissions forming an important transition universe both for equities and debt. We know the bulk of this transition potential sits in the five big-emitting sectors.
Many of the companies in these sectors are household names for both developed and emerging economies. For equities, the long trading history that exists for these companies allows us to assess in detail how transition investments in equities can fit into asset owners’ portfolios.
Transition debt forms the backbone for attracting new capital for transition plans. The lower cost and flexibility of debt markets support innovation and crucially the ability to link lending to transition-related goals and targets. Debt will also be the most effective tool to mobilise private capital from wealthy nations towards emerging markets where the bulk of emissions growth needs to be addressed.
In this section, we take a first look at the transition equity and transition debt universes. We look at some of the key questions asset owners are asking about the impact transition investments will have on their portfolios including the inflation landscape, return potential and the overall impact on portfolio-level emissions intensity.
Transition snapshot: equities
Transition investing in equity markets starts with the five highest emitting sectors. There are 158 sub-industries within GICS, the most detailed classification level. By selecting 51 sub-industries covering companies from the biggest five emitting areas of power, buildings, mobility, industry and agriculture we can create a rudimentary proxy for the transition universe. This is a simplification as several of the companies within these sub-industries would not eventually qualify as transition investments once analysis of their targets and transition plans determines where they fit within the SMI minimum criteria and classification approach. These 51 sub-sectors represent circa 95% of Scope 1 and Scope 2 carbon emissions for global equities and circa 20% of market capitalisation.
Figure 11: Transition universe share of global equities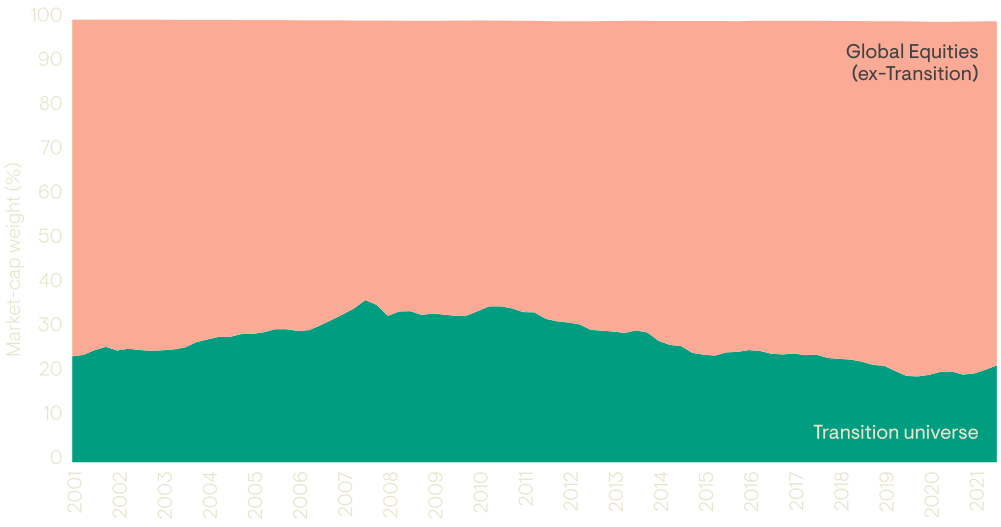
Source: Ninety One, December 2022.
While a more accurate transition universe will include an assessment of the transition potential of the underlying companies, we can use these 51 sub-sectors to proxy what the risk and return characteristics of the transition equity universe might look like.
Analysing the transition equity universe
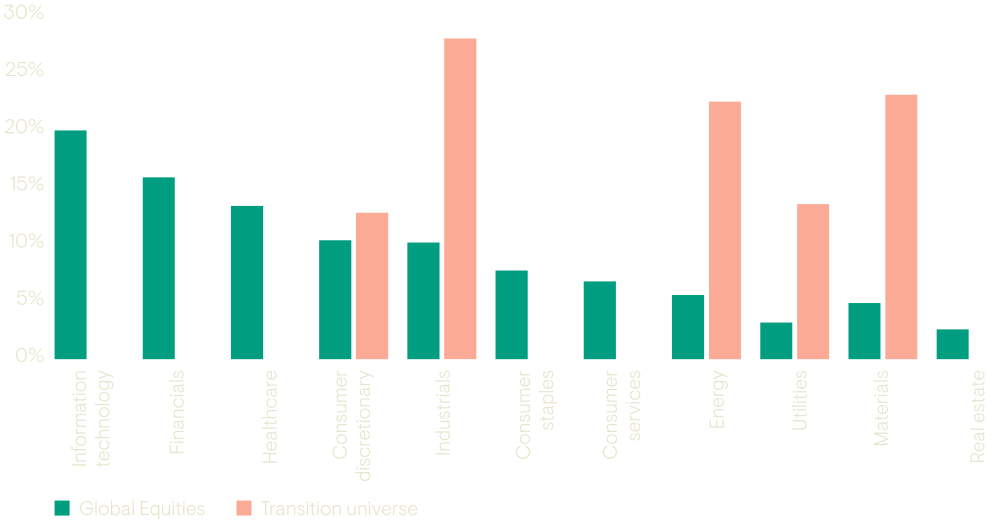
Figure 12 places these 51 sub-industries into the headline sectors and compares the exposure to the MSCI AC World Index. As would be expected, the sector breakdown of the transition universe largely reflects the inverse of global equities. Within consumer discretionary where the weights look similar, the transition universe is focused on the auto supply chains rather than the retailing and apparel sectors. At both the headline level and the sub-industry level, a transition-focused investment universe is quite different.
Figure 12: Sector breakdown of the transition universe compared with global equities
Source: Ninety One, MSCI, December 2022.
One clear characteristic high-emitting sectors have in common is economic cyclicality and so we would expect volatility to be evident in their performance. Historically this has been the case. There is also inflation sensitivity either as key elements in the supply chain, or by having a direct impact on consumer prices. To assess these inflation characteristics, we have analysed the performance of the transition universe comparing it to a global equity portfolio that excludes high-emitting sectors. Figure 13 goes back to 2000 and shows the average quarterly return of these two groups for those quarters where inflation (as measured by CPI) was in the upper quartile of observations (above 0.7%).
Figure 13: Characteristics of the transition universe and global equities (ex-transition)
| Transition universe | Global equity (ex-transition) | |
|---|---|---|
| Average return – in upper quartile inflation periods (%) | 3.8 | 2.6 |
| Volatility (all quarters, %) | 20.3 | 17.8 |
| Tracking error to global equity (all quarters, %) | 6.7 | 3.2 |
Source: Ninety One. From 2000 up to and including Q2 2022.
This is a relatively short period of history but allows the data to better represent the current set of companies in these sectors. The cyclicality of these companies is evident in the higher volatility and tracking error to global equities since 2000, but also the link with higher levels of inflation (average quarterly returns of 3.8% versus 2.6%).
It is well recognised that transition assets have historically generated their returns with far higher carbon intensity than broad market averages, and in some cases, this has led to stranded assets and the permanent impairment of capital. On a forward-looking basis our core belief is that unmanaged negative externalities will be recognised and priced by the market. We also believe that emissions should be considered on a forward-looking basis considering expected pathways. This is where the SMI’s transition categorisation is important to direct investment at those areas which have the commitment and plans to meaningfully reduce emissions.
Transition snapshot: debt markets
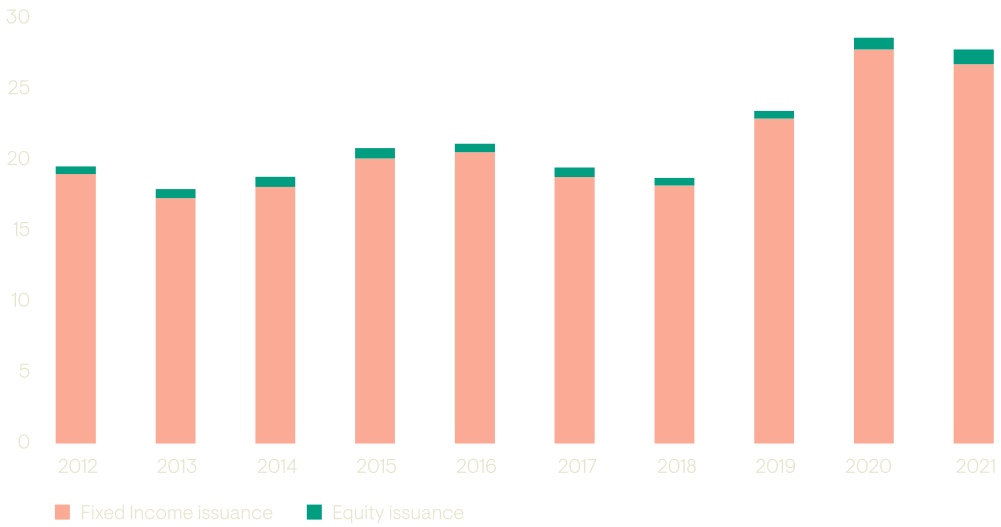
While green and sustainable bond issuance has grown substantially in recent years, high-emitting companies remain largely absent from these markets. These companies will require substantial capital to transition their businesses. The bulk of the funding required for transition finance will be raised through public and private debt markets. In any given year, corporate debt issuance is far larger than equity issuance making credit markets pivotal to transition finance.
Figure 14: New issuance globally across fixed income and equities
Source: https://www.sifma.org/resources/research/fact-book/
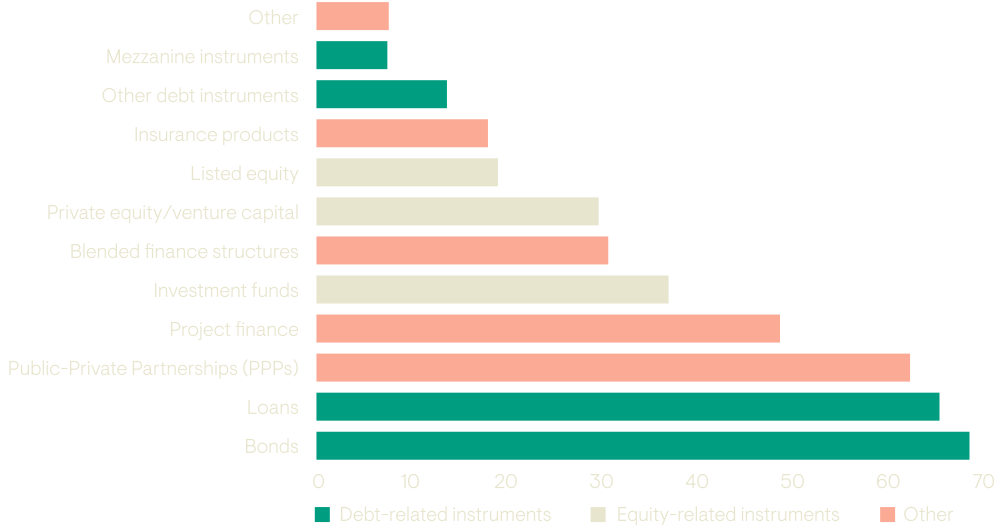
Companies find the lower cost and flexibility of debt markets compares favourably to other forms of financing. The OECD’s 2022 Industry Survey on Transition Finance reinforced this view with particular reference to transition finance.
Figure 15: Market participants view on the financing instruments likely to be used for transition finance
Source: 2022 OECD Industry Survey on Transition Finance.
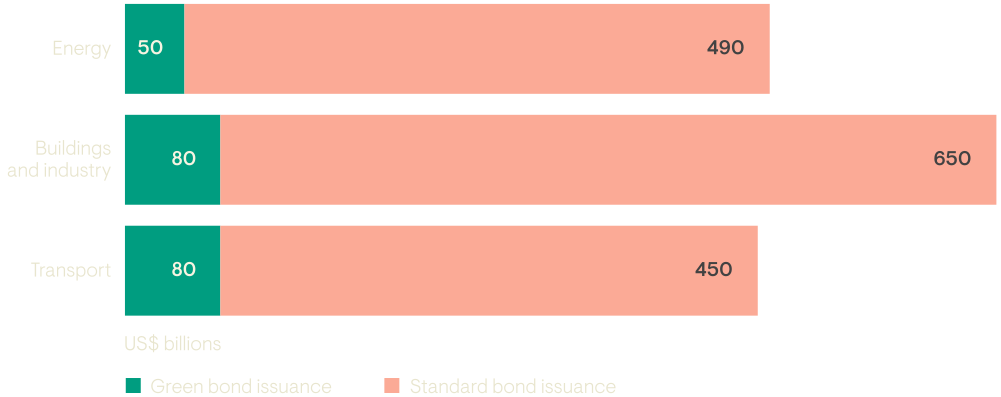
To support the growth of credible transition issuance, standards are being developed to identify and label transition activities. These standards are aligned to the top-down categorisation set out by the Sustainable Markets Initiative. The Institutional Investors Group on Climate Change (IIGCC) is looking to incorporate transition investments as part of their Climate Solutions categorisation in addition to decarbonisation investments. The Climate Bonds Initiative (CBI) has developed industry-level eligibility criteria for bonds to qualify as a transition bond. We expect this to support the growth of transition issuance as we have seen this take place with other labelled bonds. Institutional investors have snapped up green bonds including those issued by high-emitting sectors, but this is a tiny proportion of the overall issuance in these sectors.
Figure 16: Bond market by sector showing breakdown of green bonds vs. standard bonds outstanding
Source: CDP, TPI, CBI, Oliver Wyman Analysis.
Please note that this chart has been redrawn by Ninety One.
From an investor perspective, debt ownership can present a powerful opportunity to engage with companies on their transition. Corporate bonds tend to mature every three to five years meaning when debt is being re-financed, investors can link new issuance with transition plans. Equity ownership provides an opportunity for ongoing engagement with companies and the ability to vote at AGMs.
Supporting the emerging market transition
The public bond market is critically important for engaging with today’s heavy emitters – particularly in emerging markets. An analysis of carbon emission by country reveals that across the highest emitting emerging market countries, the top 10 emitting companies in each of these countries all have publicly listed bonds. Therefore, involvement in the public corporate bond markets presents the ideal opportunity to engage with the world’s heaviest emitters and ‘move the needle’ on future emissions. Institutional bond investors with influence (either through size or sophistication or both) can push companies to pursue ambitious transition plans and enhance bond indentures to improve accountability to climate commitments, reporting and use of proceeds management. Such improvements can catalyse a virtuous feedback loop in which climate-friendly lending attracts more capital and lowers an obligor’s financing costs.
The impact of transition finance on portfolios
Asset owners deciding to add allocations to transition finance want to understand how these assets might impact their portfolio.
Questions that are top of mind ask whether the transition will be inflationary, are there market returns in transition and importantly how will emissions reporting be impacted. Some initial thinking on these questions:
Transition allocations provide resilience against inflation
There is healthy debate around the inflationary versus deflationary effects of the transition to a low-carbon economic model; it seems reasonable to expect, particularly in the light of the Russian invasion of Ukraine, that there will be upward inflationary pressures in the short to medium term, but that in the longer term we will arrive at a global energy system that is cheaper and less vulnerable to supply shocks. Given the clear inflation-sensitivity of the companies within the transition universe, it is worth having a closer look at the outlook for inflation as it relates to the transition more broadly.
The inflationary effects can be categorised in two distinct ways: first, there will likely be a substantial increase in demand for certain metals and materials – as well as certain energy and agricultural inputs. For example, the IMF see potential for a metal demand boom with a fourfold increase in the value of metals production over the next two decades driven primarily by demand for copper, nickel, zinc, cobalt and lithium. This rise in demand collides with an era of structural underinvestment caused by the excesses of the last commodity upcycle, increased environmental pressure on permitting and development, and pressure from shareholders to reduce spending.
On the energy side, Goldman Sachs estimate that oil and gas investment has fallen 61% from the peak8, with the IEA modelling that current investment levels are already consistent with a net-zero emission scenario – despite the fact that 83% of primary global energy consumption is still based on fossil fuels. This inflationary force – stronger for longer demand in areas where investment has been curtailed – is referred to as ‘fossilflation’.
The second inflationary impulse is likely to arise from rising investment in the new technologies that will drive decarbonisation, catalysed by enormous government spending programmes, including the United States Inflation Reduction Act (IRA) programme, REPower EU and other commendable initiatives. The huge scale of investment will build demand in the supply chain for associated assets and services. There are three main sources of this expenditure: public spending, corporate capex and private consumption. The feed through to inflation will depend on the mix of those contributors but in aggregate we expect a strong positive impetus on demand and prices. Regulation is also likely to push up prices by directing spending for companies as well as individuals. For example, energy efficiency requirements for buildings lead to higher costs for homeowners if these requirements can only be met through extensive renovation and refurbishment measures. The spread of carbon pricing for high-emitting sectors will also likely be passed through to consumers putting pressure on end prices. In aggregate these inflationary pressures come under the heading of ‘greenflation’.
In theory, transition investments should improve portfolio resilience and diversification in periods of high inflation by providing exposure to economic areas that will benefit from these upward pricing pressures.
Return potential and increasing divergence
In the medium-to-long-run, we believe the low-carbon transition will prove Darwinian for many industries, but especially those industries that sit at the crux of the problem, namely the five transition areas we have focussed on: power, buildings, mobility, industry and agriculture. Companies in these economic areas that can successfully make the transition by either developing new technologies or via the significant decarbonisation of key industrial processes stand to be rewarded by the market via enhanced access to debt and equity financing and higher market valuations.Conversely, companies in these emissions-intensive areas that are unable to evolve will experience the opposite: we would expect them to face an increasing struggle to access capital, and to attract lower market multiples. This should present considerable opportunity for active managers seeking alpha generation as the winners and losers diverge sharply over the coming years – all the more so because the starting point includes sectors and industries that trade on a very significant discount to the broad market. We expect this ̒transition premium’ to manifest itself more clearly in the coming years.
There is one further point to make here; we highlighted in the previous section that a credible transition investing strategy is based on a categorisation framework, clear guidelines for the five categories, and a commitment to engage with high emitters. These provide the necessary structure and process for managers to identify the winners from the transition, thus maximising the alpha generating opportunity.
Transition-based targets and emissions intensity
One of the structural impediments to more widespread investment allocation towards transition sectors is the focus on portfolio-level emissions. Investors over the last three years have coalesced around targets to reduce emissions intensity in their portfolios, as expressed by emissions per dollar of revenue for the aggregate portfolio. Emissions intensity alone as a portfolio metric is flawed at this stage of the world’s transition pathway. It will become increasingly relevant in the future after more progress has been made to transition companies and countries. At this stage, the emphasis on carbon intensity is leading to reduced allocations to heavy industry and emerging markets in favour of developed market technology, healthcare or financials, as the primary means by which a portfolio manager can dramatically reduce the emissions intensity of a portfolio. How then can asset owners make a transition allocation – focused on real-world impact without blowing their carbon-emissions budget?
The solution, we believe, lies in setting targets based on “portfolio coverage”, in other words increasing the proportion of companies with science-based targets that are implementing credible transition plans. This is likely to be a more appropriate measure of success and will enable asset owners and their clients to take a long-term approach to transition investing, while monitoring progress of companies on their transition pathways and their impact on emissions. Asset owners will have the freedom to allocate to companies and countries that are working hardest to tackle climate risk through robust transition plans, even if their emissions profile today looks negative. This is entirely consistent with the view that the transition will require patient capital and active stewardship.
Reporting on dedicated transition investments should include an indication of portfolio coverage and how that is evolving. It should also include measurements on carbon impact. Ninety One have developed carbon impact reporting linked to ‘carbon avoided’ and ‘carbon reduced’ defined as follows:
Ninety One carbon avoided:emissions avoided by using a product that has less carbon emissions than the status quo. |
Ninety One carbon reduced:investments with companies that are significantly reducing GHG emissions with a credible trajectory to net zero. |
Although, the starting point for emissions intensity will be higher for transition portfolios, over the medium term, the scale of carbon avoided or reduced will provide an indicative measure of how these investments are driving down real-world emissions.
8 Source: Goldman Sachs.
Actionable steps
‘Transition investing’ is set to grow in importance in coming years. It has become clear that starving the heavy-emitting sectors of capital is not going to solve the real-world problem. The framework set out in this report intends to boost the credibility with which transition strategies and transition investments can be assessed. It is on this basis that we would make the following recommendations to asset owners:
In core investment mandates, asset owners should assess the transition plans of their heavy emitters and commit to robust engagement with those companies to encourage and catalyse their transition. This should replace a policy of divestment from all high-emitting companies.
Asset owners should consider dedicated allocations to transition strategies, both equity and debt, that specifically target the areas and sectors that need to decarbonise and incorporate robust assessment of the transition credentials of all investments in the strategy. This should include the measurement of the carbon avoided or reduced impact of the investment.
While there will inevitably be subjectivity around the appraisal of a company’s transition plan – as there has always been around the strategic and financial plan of any company – it is important that this does not get in the way of engaging with heavy-emitting companies across the main five high-emitting sectors to drive the evolution of their business models.
If the investment industry can do that in a concerted and effective fashion, there is every reason to believe that an allocation to transition assets will increasingly be seen as having the potential to make a real-world difference to the energy transition, sustainable development in emerging markets and net-zero outcomes – while adding positively to portfolio outcomes.
Breakdown of climate strategies
How a range of climate-aligned strategies impact real-world change
| Climate-aligned strategies | Reduces portfolio-level carbon footprint | Leveraged to decarbonisation trend | Invests and engages in high-emitting sectors | Influences real-world decarbonisation |
|---|---|---|---|---|
| Green infrastructure | Green infrastructure like the build out of renewable energy generation or wastewater treatment once built will displace a pre-determined amount of the high-emission alternative |
Green infrastructure projects will usually produce a finite outcome or capacity to reduce emissions. However, real-world demand for the financed assets should reduce the risk premium of the investment over its life |
Funding green infrastructure is directed towards climate solutions. In some cases these projects might indirectly help improve the carbon footprint of high-emitters e.g., more renewable capacity used in factories |
Green infrastructure will usually displace a high-emitting incumbent product or service. This has a measurable impact on reducing real-world carbon emissions and faster development will drive down transition risk |
| Green bonds | Green bonds are similar to green infrastructure where the use of proceeds will be directed to a specified project where a pre-determined capacity to reduce emissions will exist |
As with green infrastructure projects, the use of proceeds from green bonds will usually produce a finite outcome or capacity to reduce emissions. However, we expect investor demand for these assets to remain high |
It is possible for high-emitting companies to issue green bonds where the use of proceeds are ring fenced for a green initiative. However, this is small part of the green bond universe and a tiny part of high-emitter issuance |
Use of proceeds directed towards building renewable capacity or building efficiency et cetera will generate a measurable impact on real-world emissions. Growth in the asset class can drive down transition risk |
| Low-carbon index equities | Low-carbon screens based only on Scope 1 and Scope 2 emissions have lower footprints than traditional benchmarks but currently little or no account is taken of Scope 3 emissions |
Excluding high-emitting sectors will not create a portfolio that is exposed to the tailwinds and structural growth areas linked to the decarbonisation trends |
High-emitting sectors are screened and usually excluded based on Scope 1 and Scope 2 emissions |
This approach only reduces Scope 1 and 2 emissions at a portfolio level. Divestment or exclusions using this incomplete measure of emissions has minimal impact on the real economy and could potentially increase transition risk |
| Climate solutions | Climate solutions invest in the initiatives and technologies driving decarbonisation like electrification and waste management. Some of these companies can have legacy businesses with emissions |
Companies offering decarbonisation solutions are those most likely to benefit should the speed of the world’s transition pick up |
Some legacy high-emitting products and services might exist within solution providers. Ninety One’s definition requires that more than 50% of revenues must be generated by the decarbonisation activities |
Climate solutions directly contribute to emissions reduction and are essential in displacing and disrupting incumbent products and services that are not sustainable |
| Transition Investments | Emissions intensity will be higher for transition investments than other climate strategies. The higher starting point allows greater scale in seeing emissions driven down |
Transition investments in hard-to-abate but essential industries produce many of the materials needed to accelerate the transition. Demand for credible transition investments is expected to increase |
Transition finance includes high-emitting sectors that can both enable the low-carbon transition or materially improve the emissions in hard-to-abate activities based on credible transition plans |
Well-funded transitions for credible decarbonisation plans in high-emitting sectors will generate some of the largest reductions in carbon emissions over the medium to long term. It could also reduce levels of disorder and transition risk |
Authors
Contributors
General risks. All investments carry the risk of capital loss.
Explore more insights
Insights
Insights
Market and portfolio insights, webinars & events curated from across our investment teams to help you steer through changing investment landscapes.
Read more
Important Information
This communication is provided for general information only should not be construed as advice.
All the information in is believed to be reliable but may be inaccurate or incomplete. The views are those of the contributor at the time of publication and do not necessary reflect those of Ninety One.
Any opinions stated are honestly held but are not guaranteed and should not be relied upon.
All rights reserved. Issued by Ninety One.